
Highlights
- Amyloid-targeting PET imaging using ¹⁸F-Flutemetamol on a desktop preclinical PET system
- Representative datasets from two mice acquired under different biological conditions
- Planar dynamic imaging with time–activity curves to support a time-resolved view of tracer distribution
- Imaging and ROI-based quantification (%ID) supporting feasibility and workflow assessment
- Suitable for method development, tracer evaluation and early translational research
Introduction
Amyloid PET tracers play a key role in preclinical and translational research, enabling the investigation of tracer biodistribution, brain uptake and clearance mechanisms. This application example presents representative PET datasets acquired on BIOEMTECH β-eye™, focusing on imaging workflow and basic quantitative outputs, including a time-resolved dynamic dataset.
Study design
Two healthy mice were imaged independently following administration of the amyloid PET tracer. Mouse 1 underwent a 30-minute planar dynamic acquisition immediately post-injection, followed by a later 3D scan. Insights from the early dynamic dataset informed an early-time-point 3D scan (2 min p.i.) in Mouse 2 to support early-time-point brain visualization and ROI-based quantification.
Imaging protocol
For Mouse 1, 3.3 MBq of the amyloid PET tracer were administered, followed by a 30-minute planar dynamic acquisition initiated immediately post-injection. A subsequent 10-minute 3D acquisition was performed at 35 minutes post-injection, generating a representative whole-body dataset.
For Mouse 2, 3 MBq of the tracer were administered. The animal was euthanized and imaging was performed at 2 minutes post-injection using a 10-minute 3D acquisition.
Animals were positioned consistently to ensure reproducible imaging geometry and ROIs were defined on selected organs to extract percentage injected dose (%ID) values.
Results
Representative datasets were acquired successfully for both animals, combining a planar dynamic sequence (Mouse 1) with static 3D whole-body imaging in both animals. This enabled ROI-based quantification reported as percentage injected dose (%ID) in selected organs. The quantitative readouts are summarized below for each animal, supporting straightforward within-animal comparison across regions.
Figure 1: Planar dynamic imaging sequence following administration of the amyloid PET tracer (Mouse 1). Total acquisition duration: 30 min.
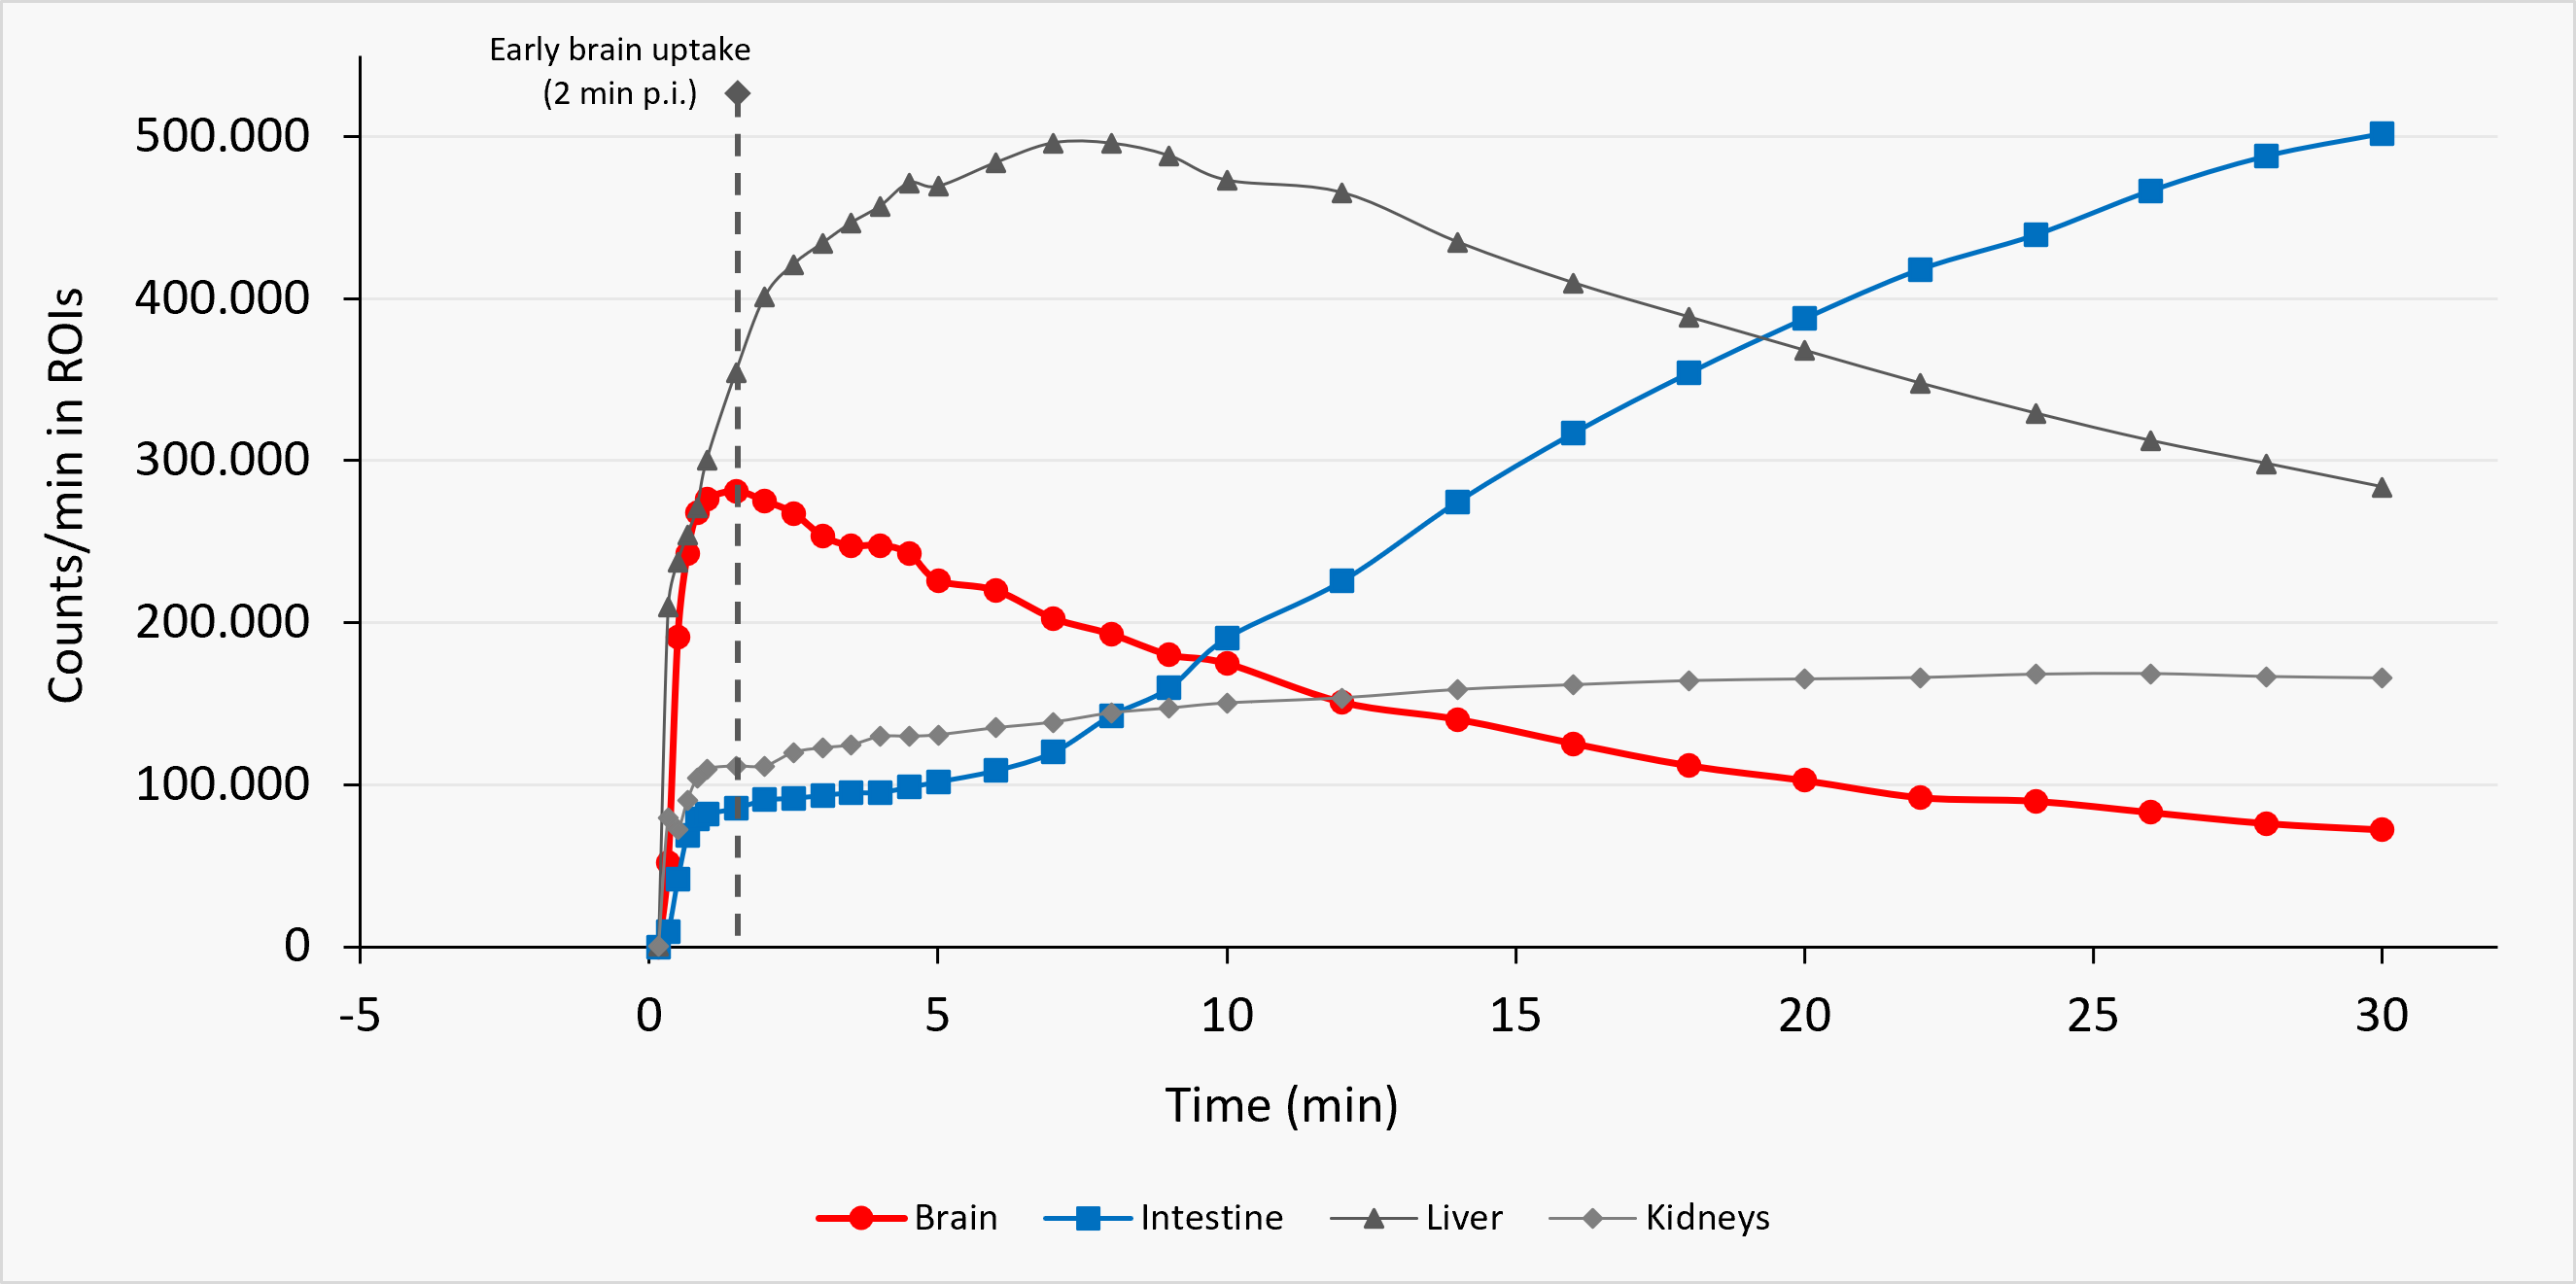
Figure 2: Time-activity curves derived from a 30-minute planar dynamic acquisition (Mouse 1), illustrating relative tracer kinetics within the same acquisition.
Figure 3: PET imaging of Mouse 1 acquired with a 10-minute scan duration, 35 minutes post-injection and an injected activity of 3.3 MBq
| Organ | %ID |
| Left kidney | 2.8% |
| Right kidney | 3.2% |
| Intestine | 19.5% |
Table 1: ROI-based %ID values for Mouse 1
Figure 4: PET imaging of Mouse 2 acquired with a 10-minute scan duration, 2 minutes post-injection and an injected activity of 3 MBq
| Organ | %ID |
| Heart | 2.4% |
| Left kidney | 5.4% |
| Right kidney | 6.3% |
| Brain | 8.7% |
Table 2: ROI-based %ID values for Mouse 2.
Conclusion
This application example demonstrates ¹⁸F-flutemetamol imaging on BIOEMTECH β-eye™, combining a planar dynamic dataset with static 3D whole-body imaging and representative ROI-based quantification (%ID). SUV-based metrics can be provided upon request within a standardized quantitative analysis workflow. The results support the use of desktop preclinical PET systems for amyloid-tracer workflows in early-stage research and method development.