
*This work was presented at the European Molecular Imaging Meeting | EMIM 2026, Ljubljana, Slovenia, March 2026.
Introduction
Colorectal cancer (CRC) progression is associated with genetic and epigenetic alterations that disrupt metabolic pathways, often resulting in increased glycolysis and anabolic activity [1, 2]. These changes are not uniform across tumor types, leading to distinct metabolic phenotypes that can influence both tumor behavior and therapeutic response.
Preclinical CRC models reflect this heterogeneity. The HT29 cell line exhibits a more differentiated epithelial phenotype [3], whereas SW480 cells are associated with increased glucose utilization and altered metabolic activity [4].
[¹⁸F]FDG PET imaging provides a non-invasive method to assess glucose uptake in vivo, offering a functional readout of tumor metabolism.
The aim of this work was to evaluate whether [¹⁸F]FDG PET imaging can reliably differentiate metabolic phenotypes between HT29 and SW480 xenografts, while also assessing the impact of physiological metabolic activity on quantitative imaging metrics.
Materials and Methods
Two female SCID mice bearing HT29 and SW480 xenografts were included in this exploratory study. Each animal received an intravenous administration of 3 MBq of [¹⁸F]FDG, followed by PET imaging at 60 minutes post-injection.
Imaging was performed with a 20-minute acquisition, using the β-eye™ preclinical PET system (BIOEMTECH, Greece).
Image analysis was conducted using the Imalytics (Gremse-IT) software platform. Volumes of interest were defined for tumor and reference tissues to extract SUVmean and SUVmax values.
Qualitative assessment was additionally performed to identify physiological metabolic signals, including brown adipose tissue activity and focal inflammatory uptake.
Results
FDG PET imaging showed a clear difference in tracer uptake between the two tumor models (Figure 1).
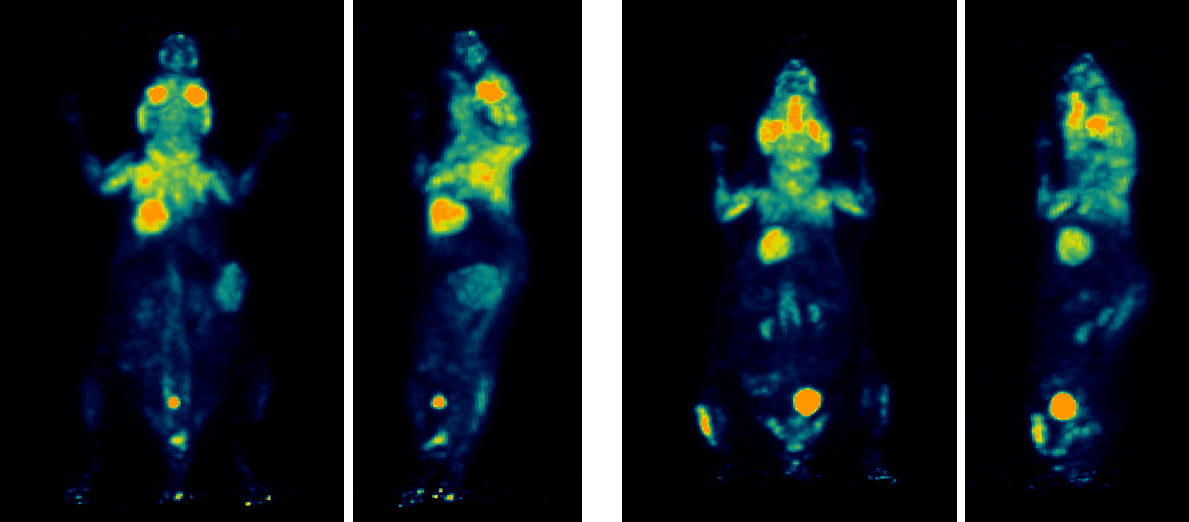
Figure 1. Maximum intensity projection (MIP) images from [¹⁸F]FDG PET imaging of colorectal cancer xenografts. Higher tracer tumor uptake is observed in the SW480 model (left) compared to HT29 (right). The HT29 xenograft shows focal uptake in the left hind limb, consistent with localized inflammation. Increased FDG uptake in brown adipose tissue is also evident, particularly in the SW480-bearing model.
SW480 xenografts exhibit higher FDG uptake (SUVmean: 2.20; SUVmax: 2.60), consistent with increased glycolytic activity compared to HT29 (SUVmean: 0.80; SUVmax: 1.10) (Table 1).
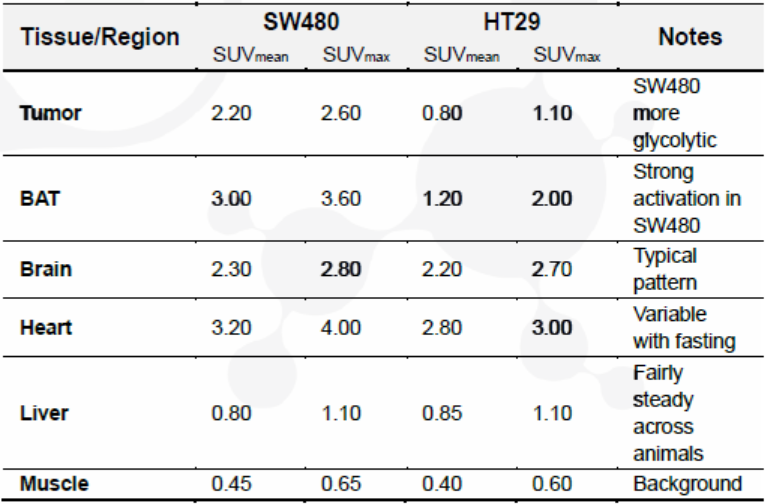
Table 1. Quantitative PET metrics (SUVmean/SUVmax) in SW480 and HT29 xenografts.
In addition to tumor-specific uptake, physiological metabolic activity was observed. Elevated FDG uptake in brown adipose tissue was particularly evident in the SW480-bearing model, while focal uptake in the hind limb of the HT29 model was consistent with localized inflammation.
Background uptake in liver and muscle was comparable between models, suggesting that observed differences were tumor-specific, although influenced by systemic metabolic signals.
Discussion
This study demonstrates that [¹⁸F]FDG PET imaging can effectively differentiate between metabolically distinct colorectal cancer xenograft models. The higher tracer uptake observed in SW480 tumors is consistent with their more glycolytic phenotype and is indicative of distinct underlying metabolic characteristics.
Importantly, the detection of physiological metabolic signals underscores a key challenge in quantitative PET analysis. Uptake in brown adipose tissue and inflammatory regions introduces variability that is not directly related to tumor biology, potentially impacting data normalization and interpretation.
These findings have practical implications for preclinical study design. Systemic metabolic activity may confound the interpretation of treatment response or baseline tumor metabolism, particularly in small-scale or early-stage studies. Accounting for these factors may improve the reliability and interpretability of PET-derived measurements in preclinical studies.
Conclusions
[¹⁸F]FDG PET imaging provides a robust, non-invasive method for distinguishing and quantifying metabolic phenotypes in colorectal cancer models of HT29 and SW480 xenografts. Beyond tumor characterization, the influence of physiological metabolic signals highlights the need for careful interpretation of quantitative imaging data. Accounting for these factors may improve the reliability and interpretability of PET-derived measurements in preclinical studies.
Key points
- [¹⁸F]FDG-PET enables non-invasive differentiation of colorectal tumor metabolic phenotypes.
- SW480 xenografts exhibit higher glycolytic activity than HT29.
- Physiological FDG uptake (e.g., brown adipose tissue, inflammation) can affect quantitative readouts.
- Accounting for systemic metabolic signals improves robustness and reproducibility of PET-based studies.
References
- Hanahan, D., & Weinberg, R. A. (2011). Hallmarks of cancer: the next generation. Cell, 144(5), 646-674.
- Brown, R. E., et al (2018). Colorectal cancer and metabolism. Current colorectal cancer reports, 14(6), 226-241.
- Baricault, L., et al (1995). Use of HT-29, a cultured human colon cancer cell line, to study the effect of fermented milks on colon cancer cell growth and differentiation. Carcinogenesis, 16(2), 245-252.
- Tomita, N., et al (1992). Isolation and characterization of a highly malignant variant of the SW480 human colon cancer cell line. Cancer Research, 52(24), 6840-6847.
Acknowledgments
The data presented in this white paper were generated through a collaboration between the Radiopharmaceutical Chemistry Group at INRASTES, NCSR “Demokritos” (Dr. Ioannis Pirmettis) and NuclearPharm.
Please note that animal care and use was conducted at an authorized user establishment in compliance to European legislation on the protection of animals used for scientific purposes (Directive 2010/63/EU).