
Collaboration: This work was conducted in collaboration with Antonio Shegani and the Radiopharmaceutical Chemistry Laboratory, INRASTES, NCSR “Demokritos.”
Overview
¹⁸F-FDG PET provides non-invasive, quantitative metabolic information and can support metabolic phenotyping across tumor models by revealing both tumor-specific uptake patterns and incidental physiological signals that may influence biodistribution and study interpretation.
In this set of examples, we explored distinct [¹⁸F]FDG uptake profiles across:
- SW480 colorectal tumors (high uptake, consistent with elevated glycolysis),
- HT29 colorectal tumors (more moderate and localized uptake),
- 4T1 breast tumors (intense uptake in the primary lesion and in draining lymph nodes, consistent with metastatic behavior).
Tumor models and preparation (HT29 & SW480)
Female SCID mice (6–8 weeks old; ~20–25 g) were used for the colorectal tumor case studies, with two groups:
- HT29 model: n=10 mice
- SW480 model: n=10 mice
Tumors were established by subcutaneous inoculation in the left flank using 5 × 10⁶ cells in 100 μL PBS/Matrigel (1:1). Tumor growth was monitored 2-3 times per week by caliper measurements, and animals entered imaging once tumors reached approximately 100-150 mm³.
[¹⁸F]FDG PET imaging protocol
Animals were fasted for 4 h (water ad libitum). [¹⁸F]FDG was administered intravenously (3 MBq), followed by a 60 min uptake period in a warm, low-stress environment. Imaging was performed under 1.5–2.0% isoflurane anesthesia with a 20 min acquisition on a small-animal PET system (BIOEMTECH β-eye™).
Image processing and quantification (Imalytics, Gremse-IT)
To move from qualitative visual assessment to quantitative evidence, images were reconstructed and analyzed using Imalytics, enabling VOI-based calculation of SUVmean and SUVmax for tumors and reference tissues.
In addition, we used Imalytics to:
- quantify [¹⁸F]FDG uptake,
- compare metabolic activity between tumor models, and
- calculate SUVs, ID/g, and %ID/organ (where applicable).
Observations across models
SW480 colorectal tumors
SW480 tumors demonstrated high [¹⁸F]FDG uptake, consistent with elevated glycolysis. In one case, physiological BAT activation was also observed, a known phenomenon influenced by parameters such as temperature, stress, and metabolic state, highlighting how normal glucose metabolism can shape biodistribution (Figure 1).
Figure 1: Representative [¹⁸F]FDG PET imaging demonstrating high tracer uptake consistent with elevated glycolytic activity. Acquisition conditions: 3 MBq [¹⁸F]FDG intravenously, 1 h post-injection, 20 min acquisition.
HT29 colorectal tumors
HT29 tumors showed a more moderate and localized uptake profile. In one animal, an incidental hind-limb hotspot was detected, consistent with inflammation/infection and unrelated to the tumor, underscoring how PET can reveal confounding physiological findings (Figure 2).
Figure 2: Representative [¹⁸F]FDG PET imaging showing a more moderate and localized uptake profile. Acquisition conditions: 3 MBq [¹⁸F]FDG intravenously, 1 h post-injection, 20 min acquisition.
4T1 breast tumors
Across tumor models, distinct uptake profiles reflect underlying tumor biology; for 4T1, examples indicate intense uptake in the primary lesion and in draining lymph nodes, consistent with the model’s metastatic behavior (Figure 3).
Figure 3: Representative [¹⁸F]FDG PET imaging with intense uptake in the primary lesion and in draining lymph nodes, consistent with metastatic behavior. Acquisition conditions: 3 MBq [¹⁸F]FDG intravenously, 1 h post-injection, 20 min acquisition.
Beyond tumor uptake: a quality-control and welfare signal
These examples also illustrate how PET can detect secondary issues (e.g., inflammation/infection or physiological BAT uptake) that may confound biodistribution readouts. Early identification supports data integrity, study interpretation and ethical compliance by adding a quality-control layer to preclinical workflows.
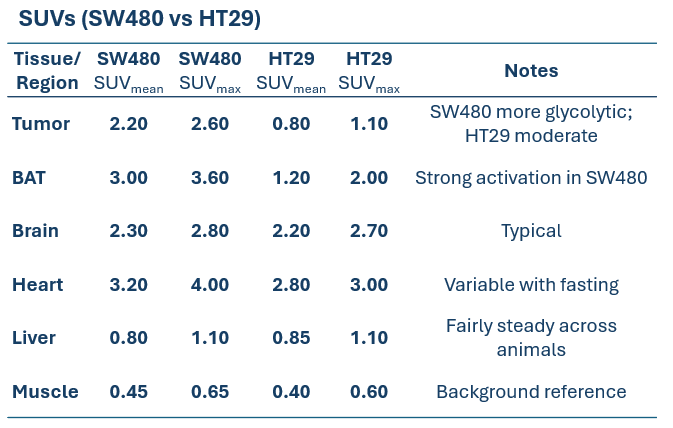
Table 1: SUVmean/SUVmax comparison across regions (SW480 vs HT29) under standardized acquisition conditions (3 MBq intravenously – 1 h post-injection – 20 min acquisition).
Why it matters
By combining high-resolution preclinical PET with structured post-processing, [¹⁸F]FDG imaging can capture:
- tumor-specific metabolic signatures, and
- incidental physiological signals that may affect biodistribution,
thereby supporting model selection, study interpretation, and experimental design in preclinical oncology workflows.