
These mouse phantom studies demonstrate the versatility of γ-eye™ for quantitative imaging across a broad range of radionuclides relevant to preclinical radiopharmaceutical research.
By acquiring images at characteristic photon energies for each radionuclide or decay chain, γ-eye™ supports energy-resolved imaging and quantitative assessment across diverse isotope types, including established gamma-emitting radionuclides, therapeutic beta-emitters and alpha-emitting radionuclides with imageable photon emissions.
Together, these studies highlight the value of γ-eye™ for protocol optimization, activity quantification and evaluation of imaging performance across multiple radionuclides.
Individual radionuclide entries
Below, you can explore representative mouse phantom images and corresponding quantification plots for each radionuclide.
Actinium-225
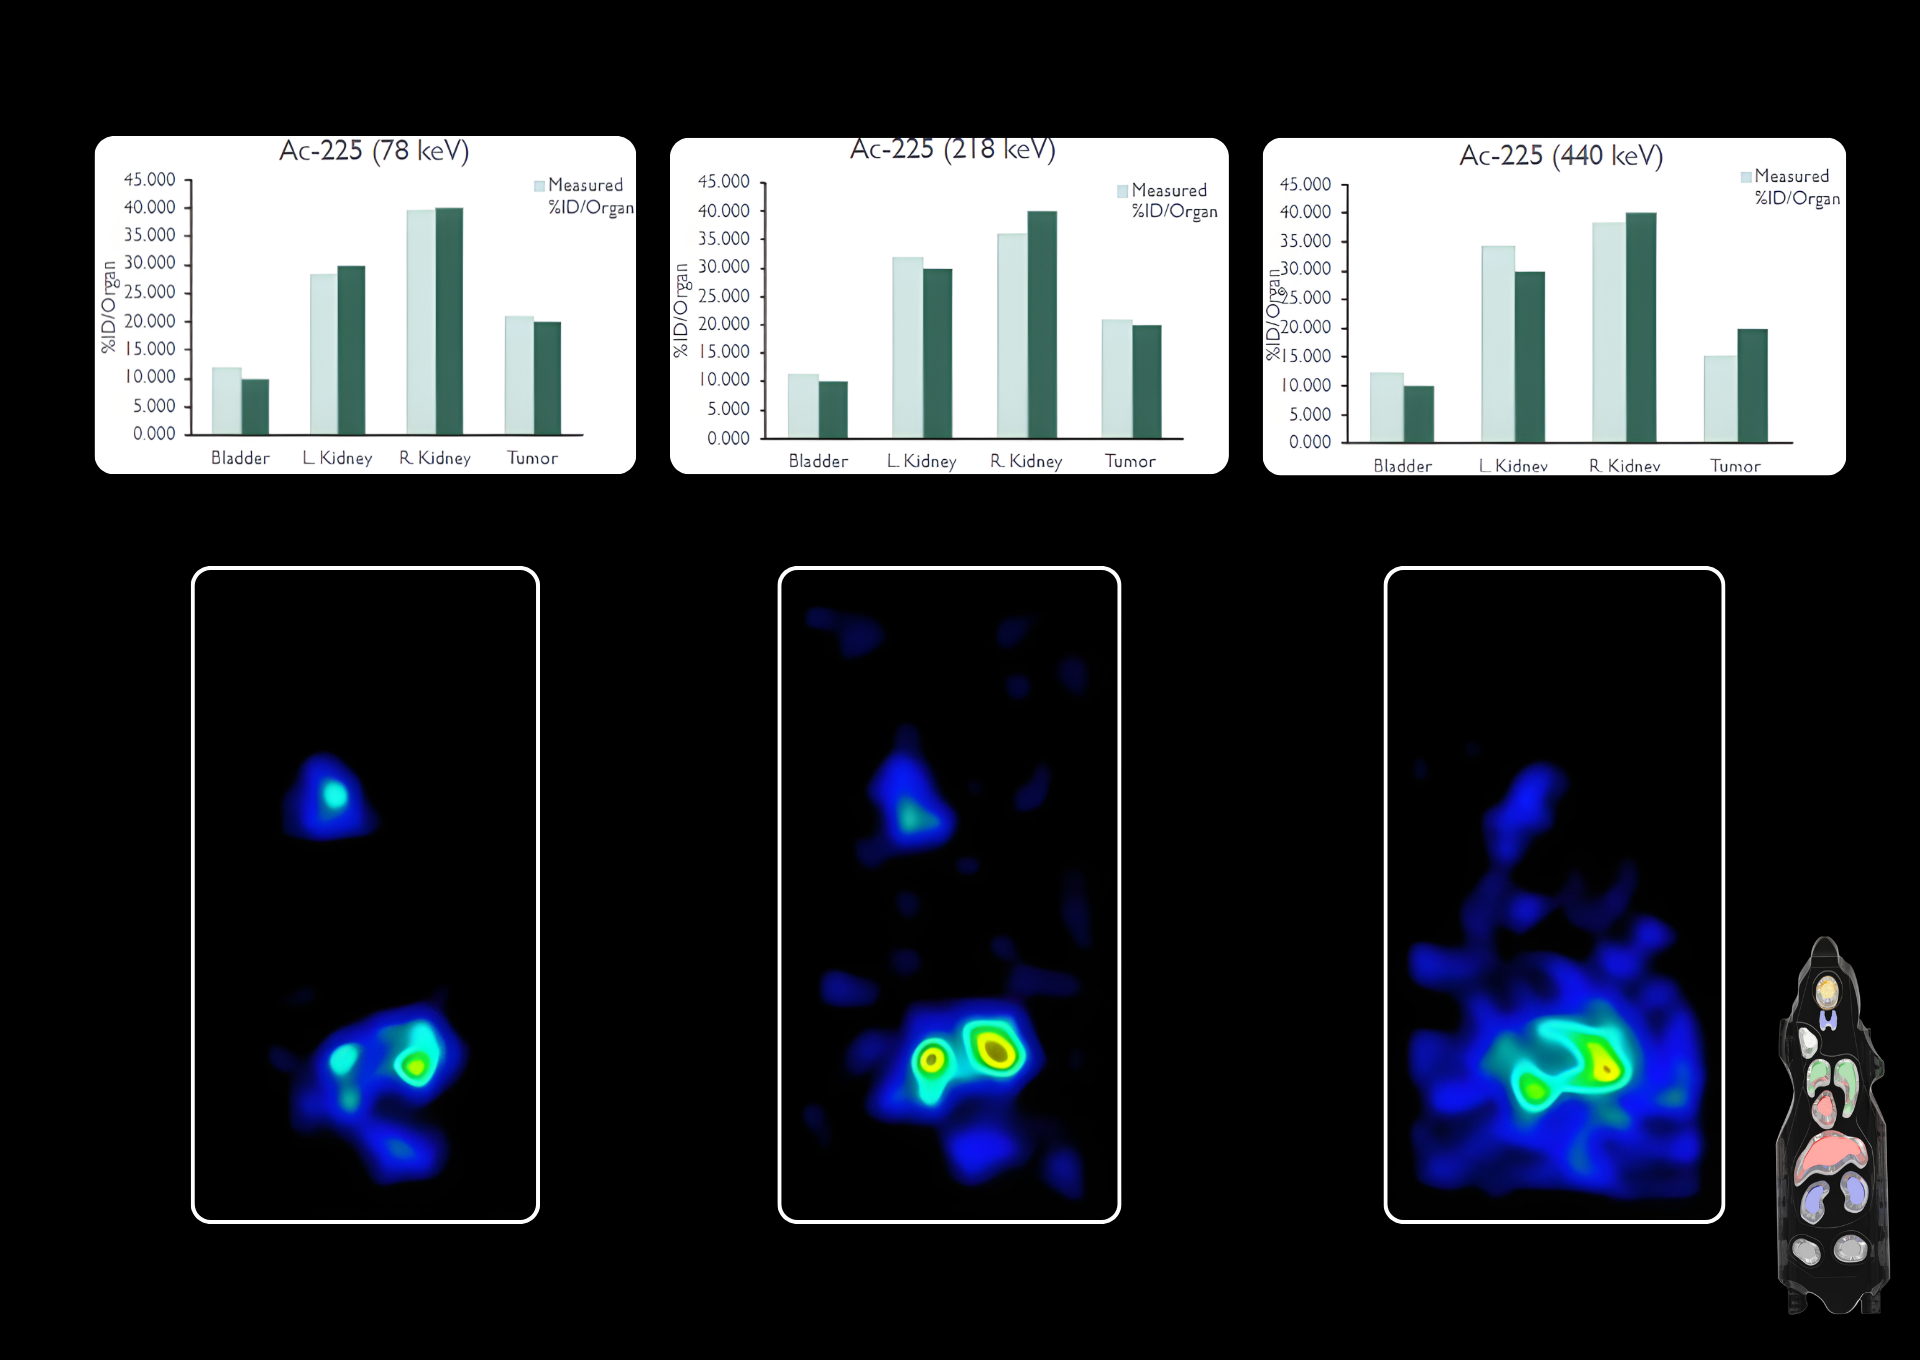
Figure 1: Mouse phantom imaging with ²²⁵Ac, acquired at three characteristic energy peaks of the decay chain, with corresponding activity quantification plots.
Lutetium-177
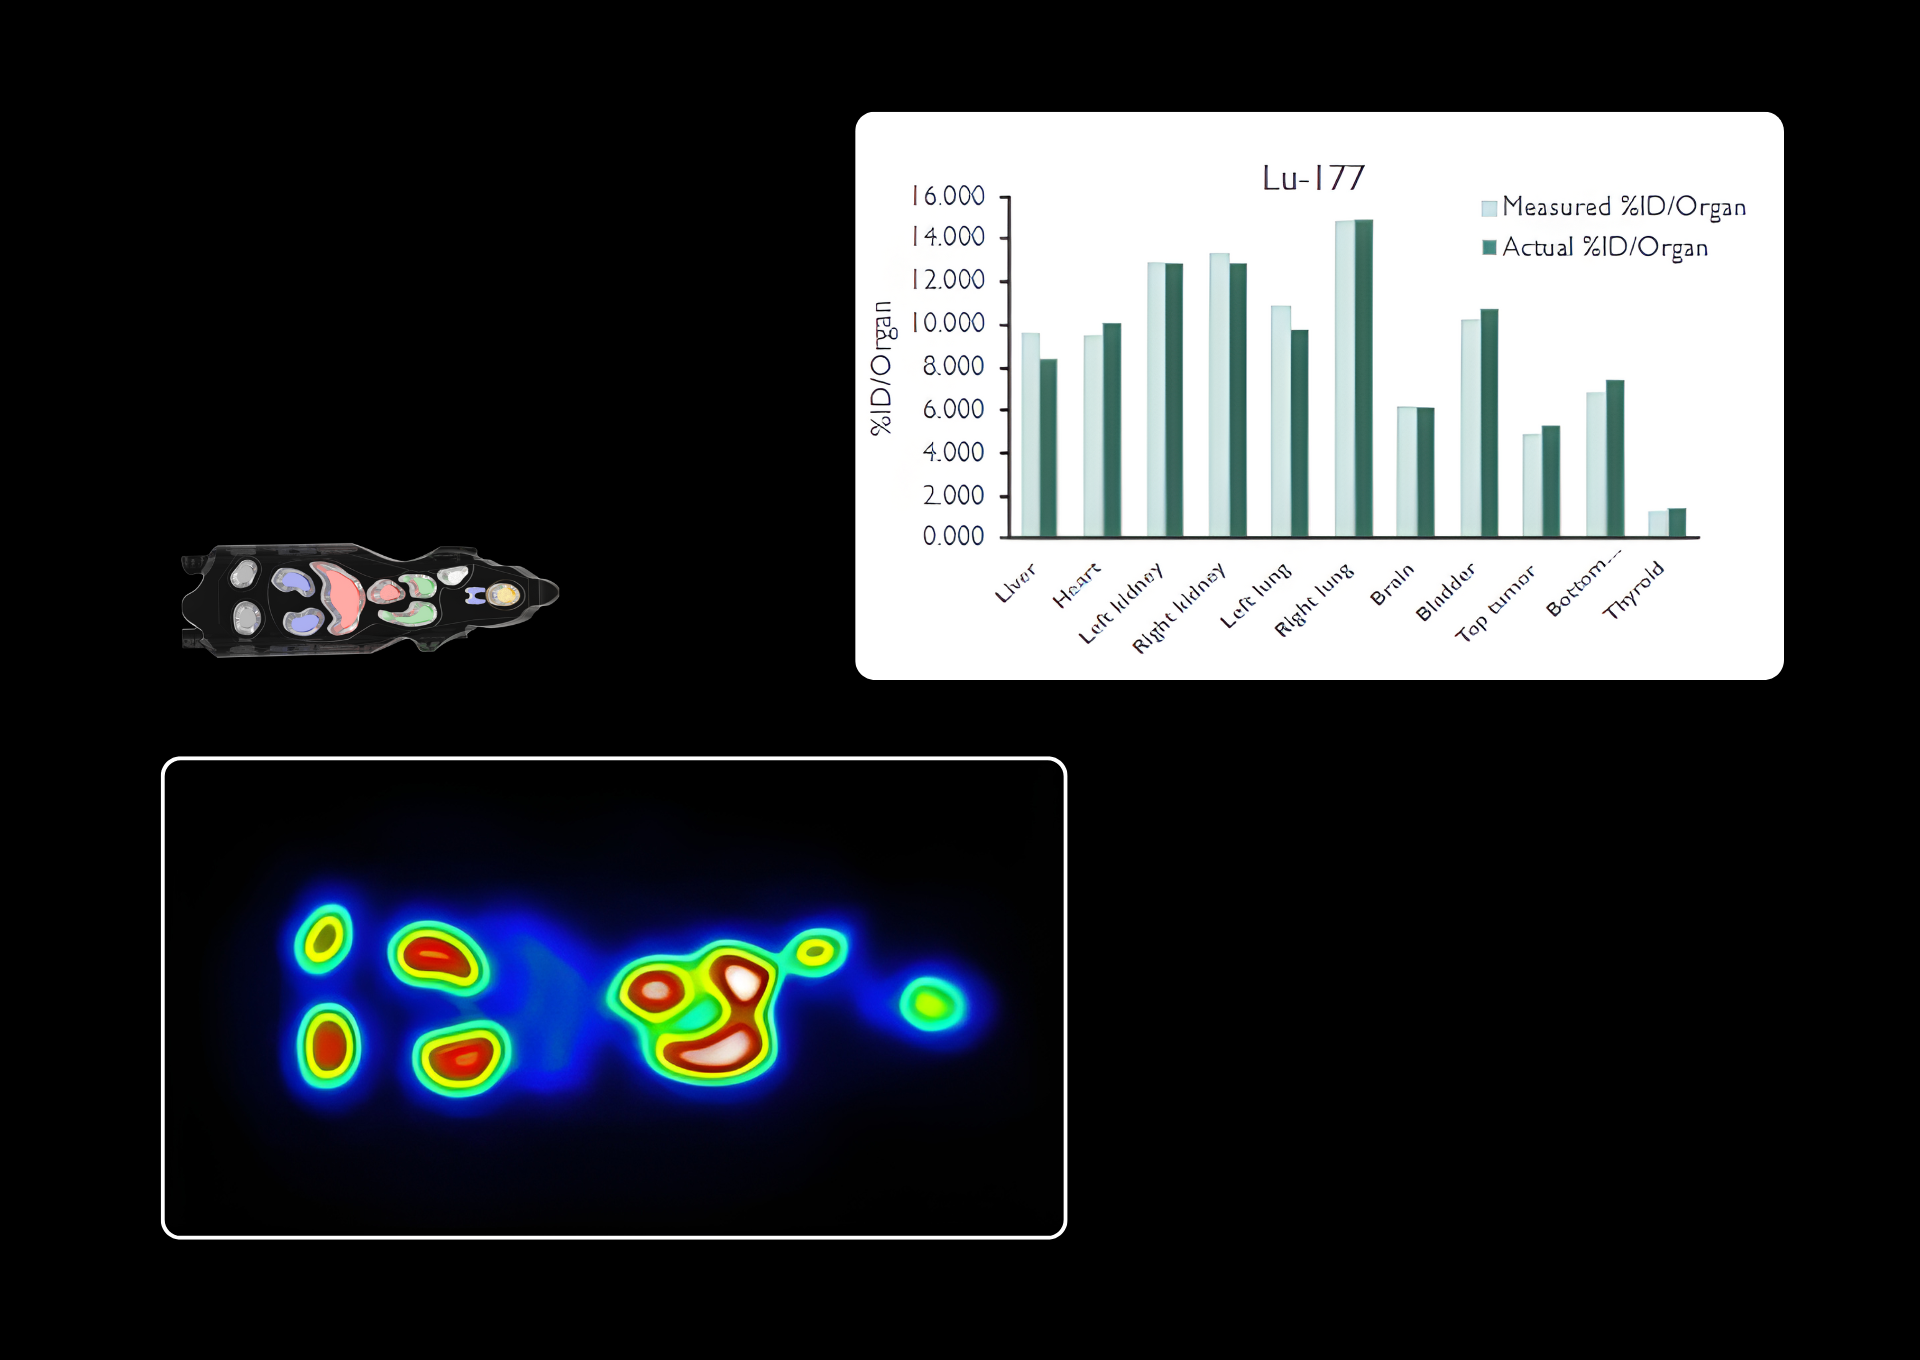
Figure 2: Mouse phantom imaging with ¹⁷⁷Lu, acquired at the 113 keV and 208 keV energy peaks, with corresponding activity quantification plots.
Lead-212
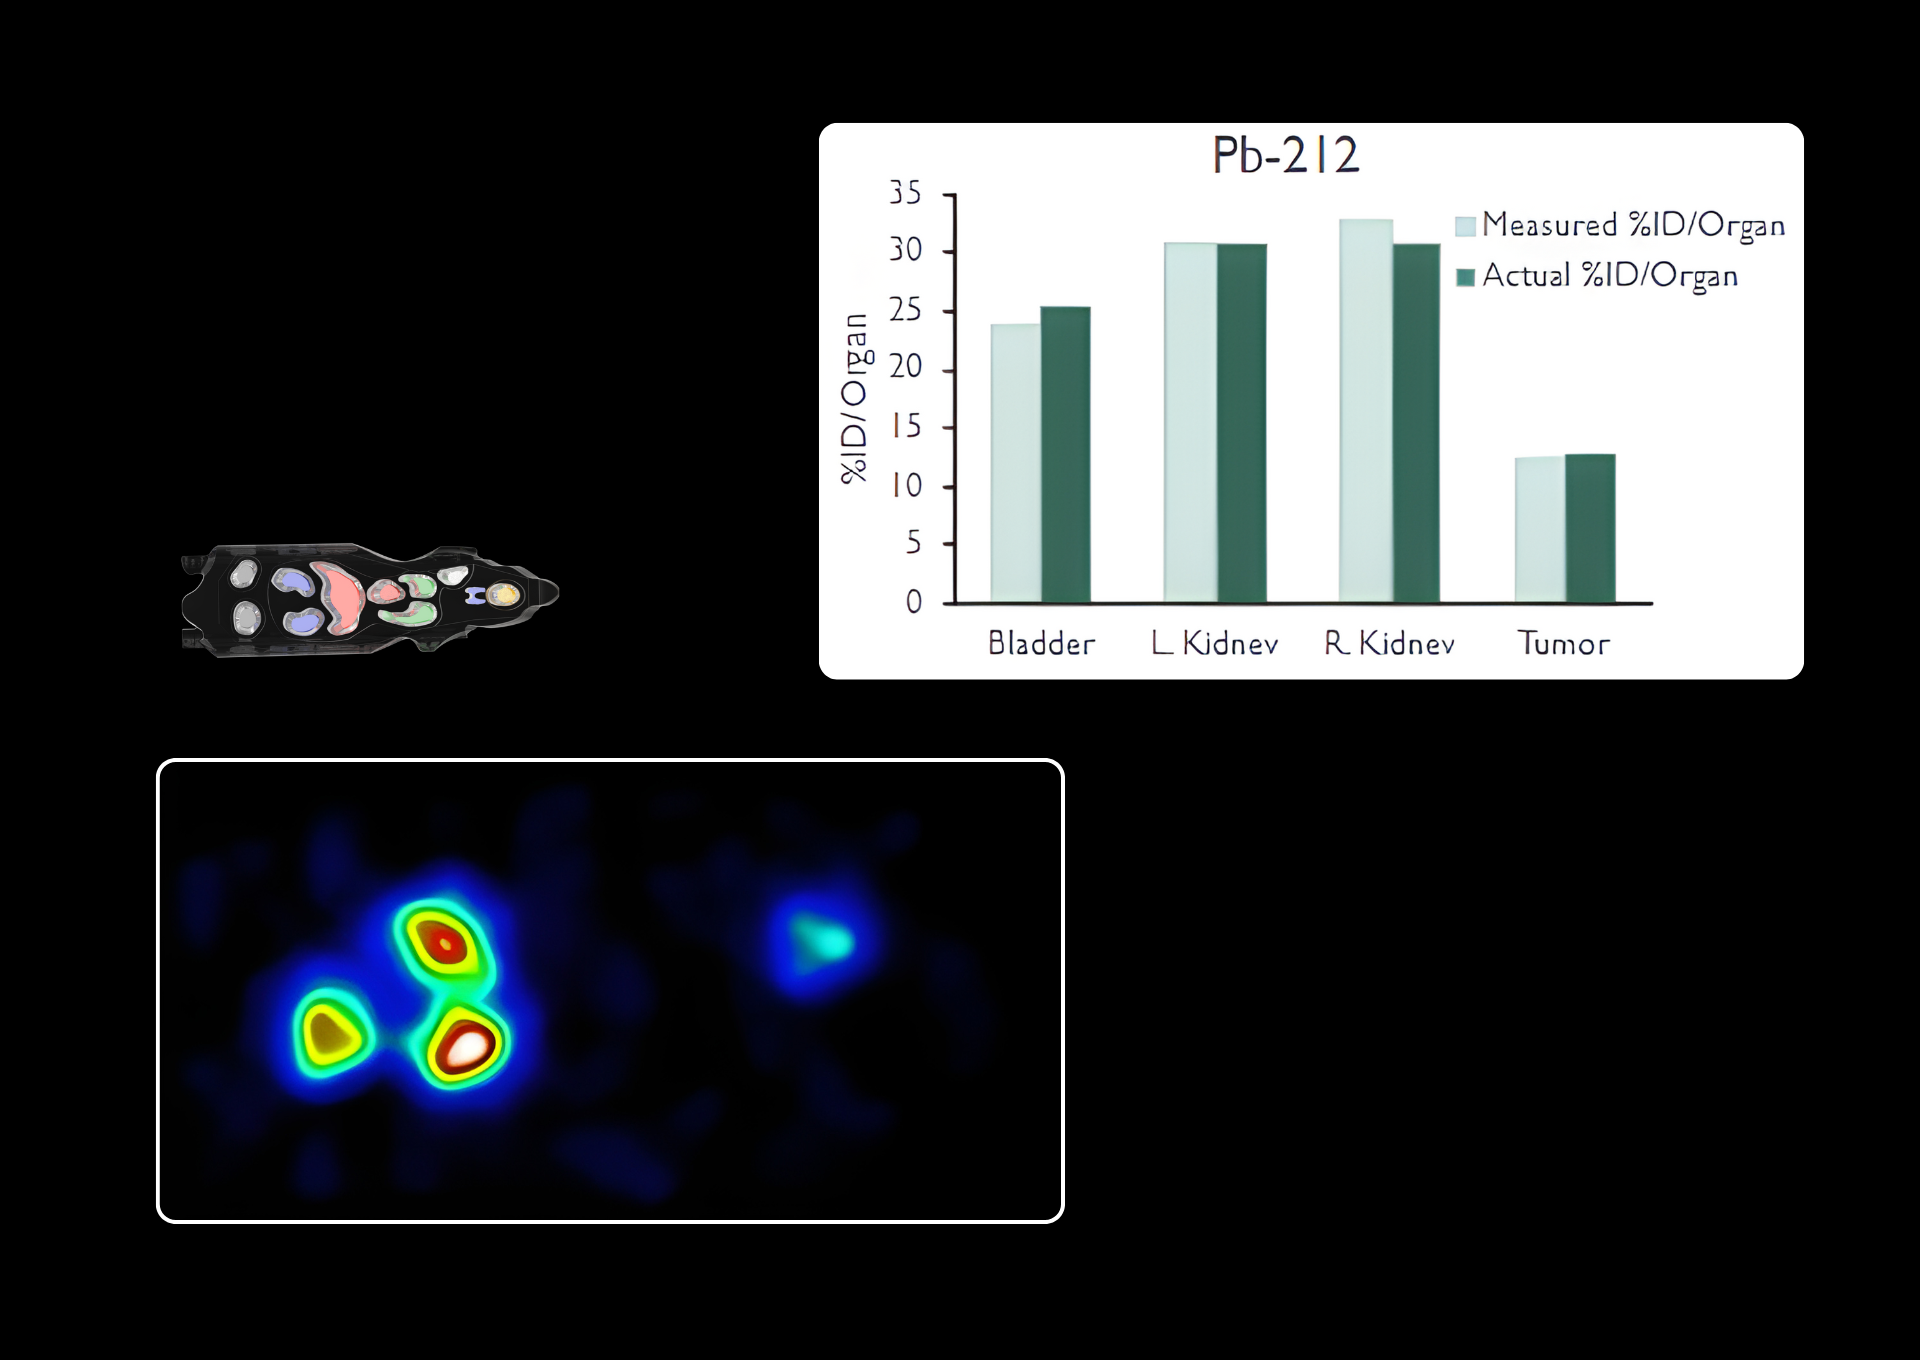
Figure 3: Mouse phantom imaging with ²¹²Pb, acquired at the 77 keV and 238 keV energy peaks, with corresponding activity quantification plots.
Lead-203
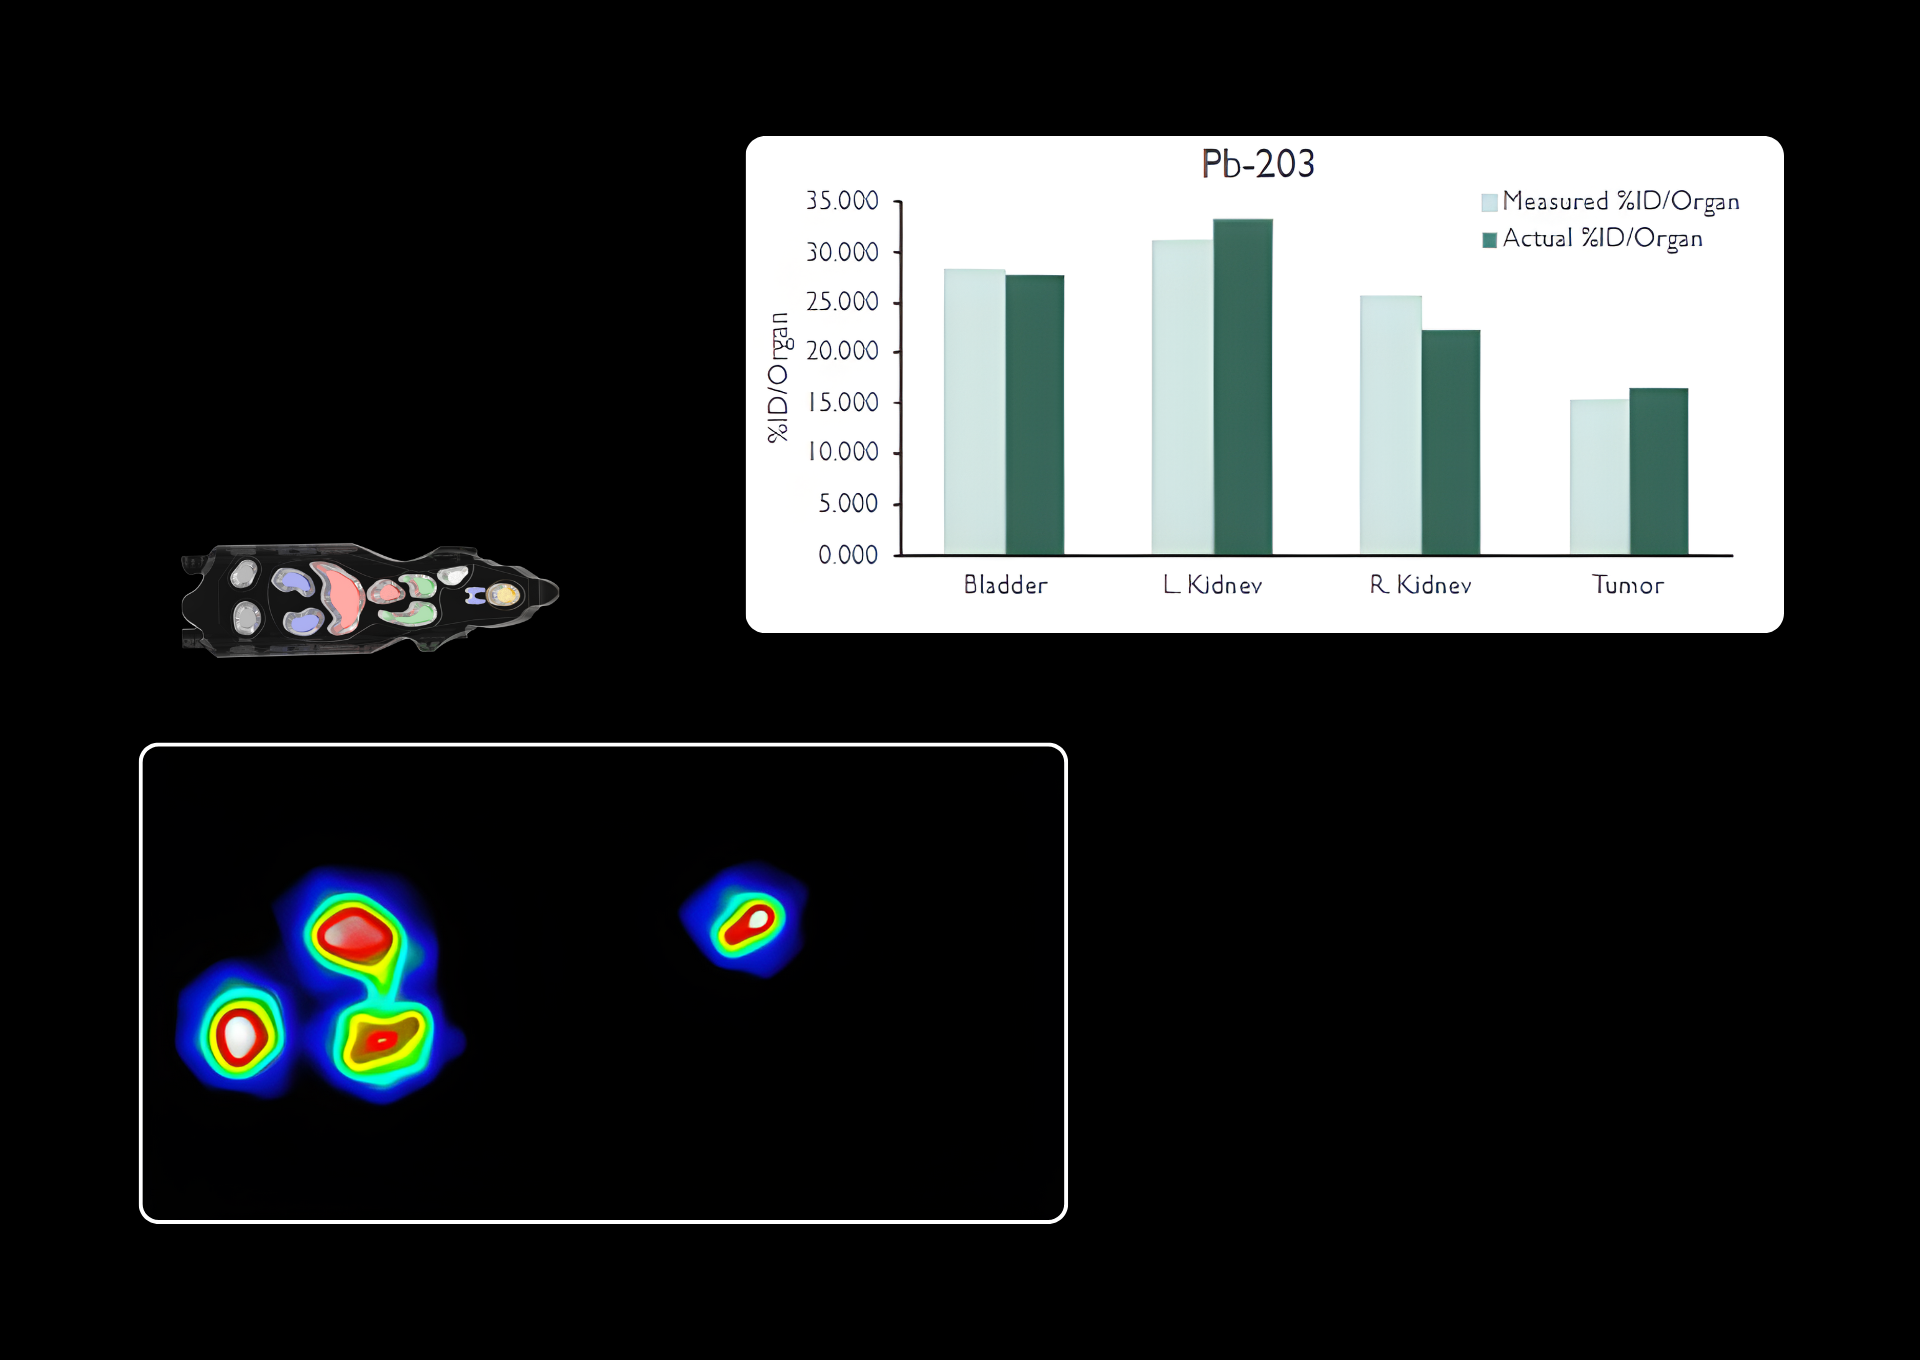
Figure 4: Mouse phantom imaging with ²⁰³Pb, acquired at the 73 keV and 280 keV energy peaks, with corresponding activity quantification plots.
Radium-223
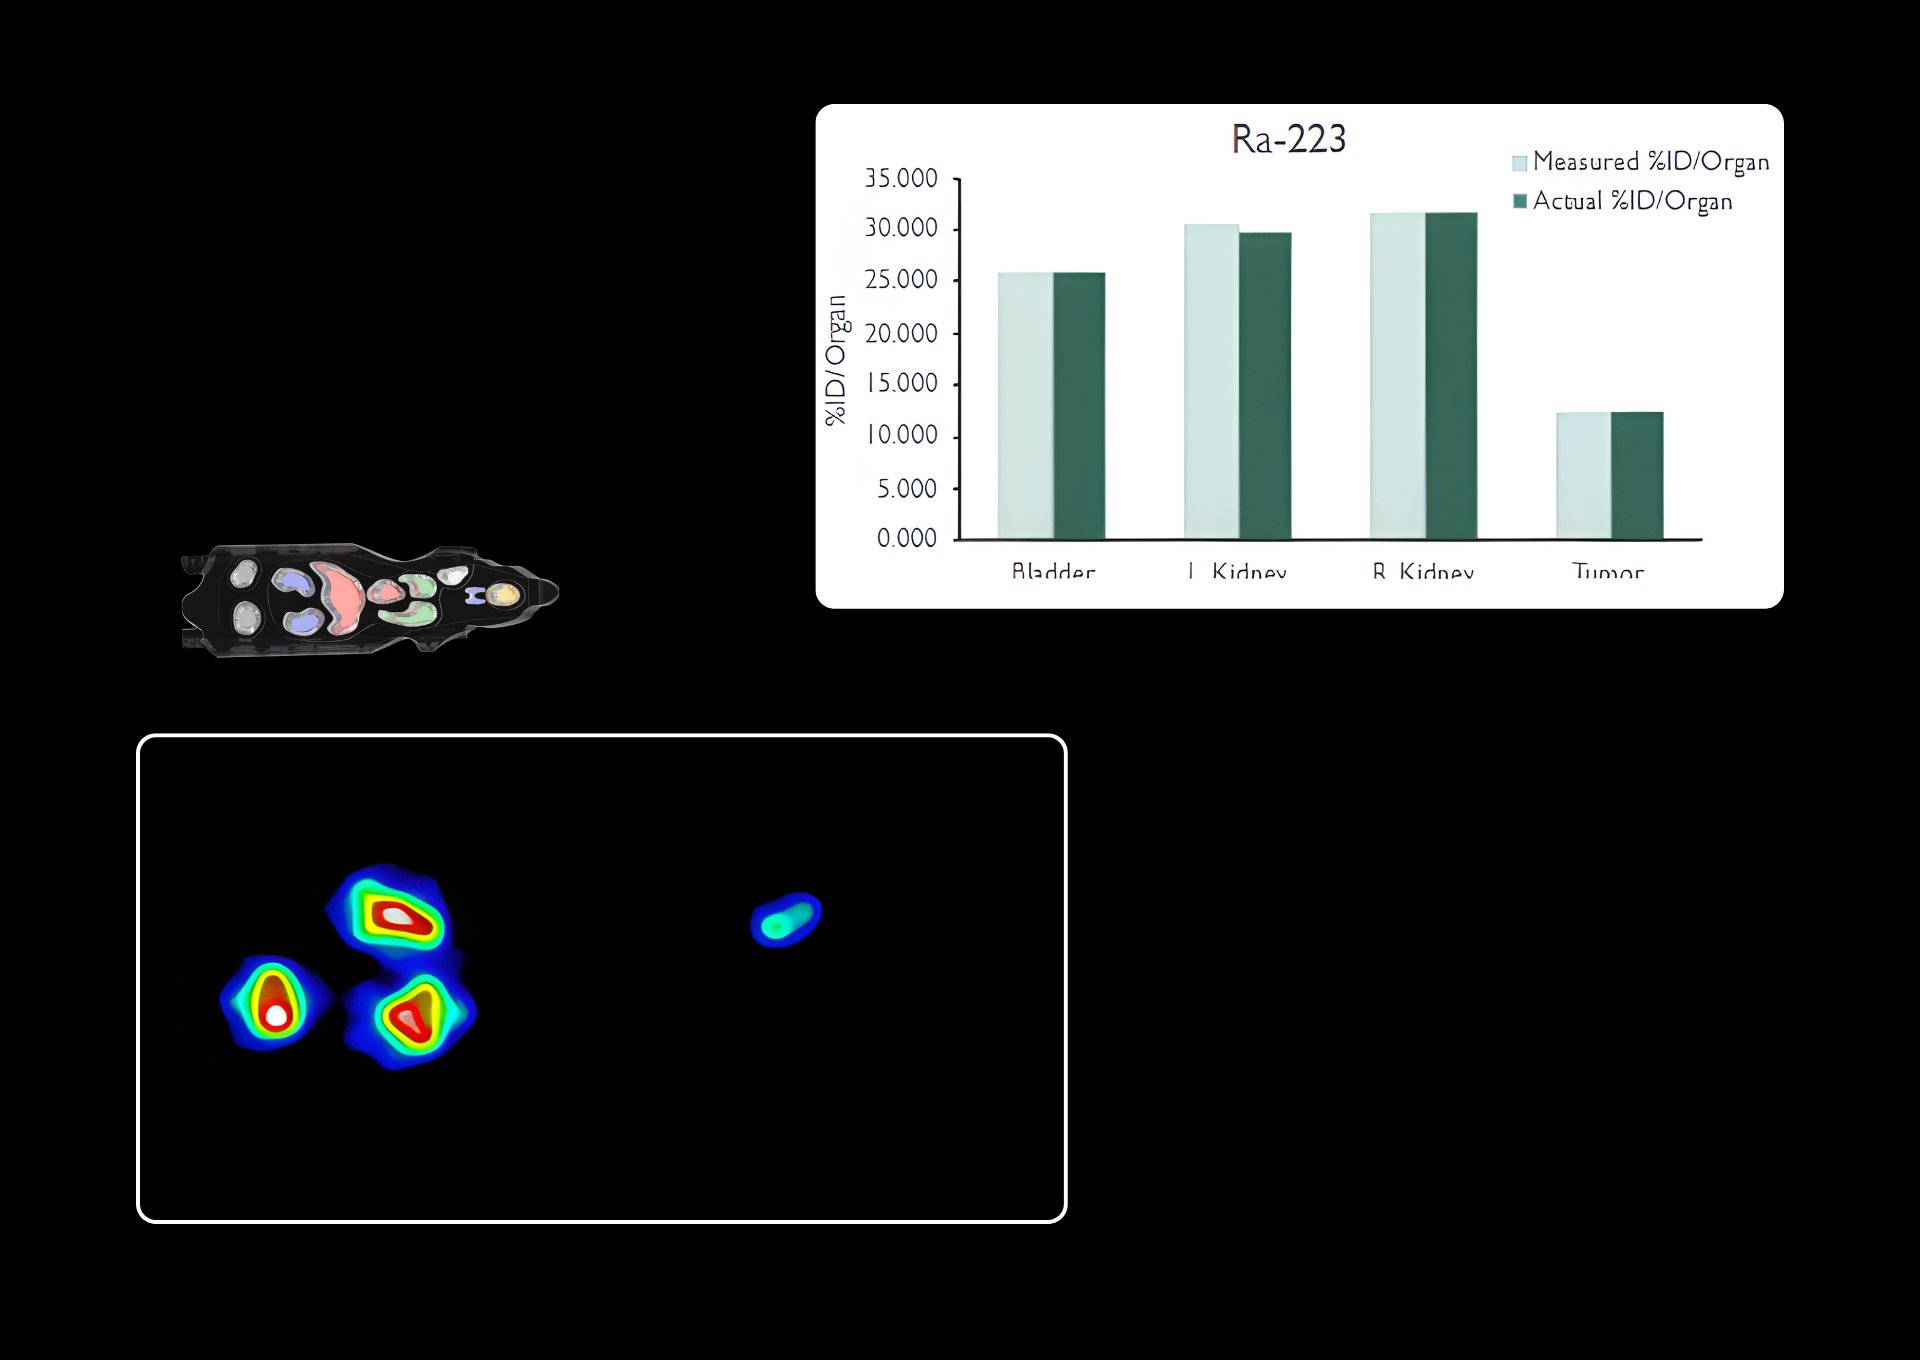
Figure 5: Mouse phantom imaging with ²²³Ra, acquired at characteristic energy peaks of the decay chain, with corresponding activity quantification plots.
Terbium-161
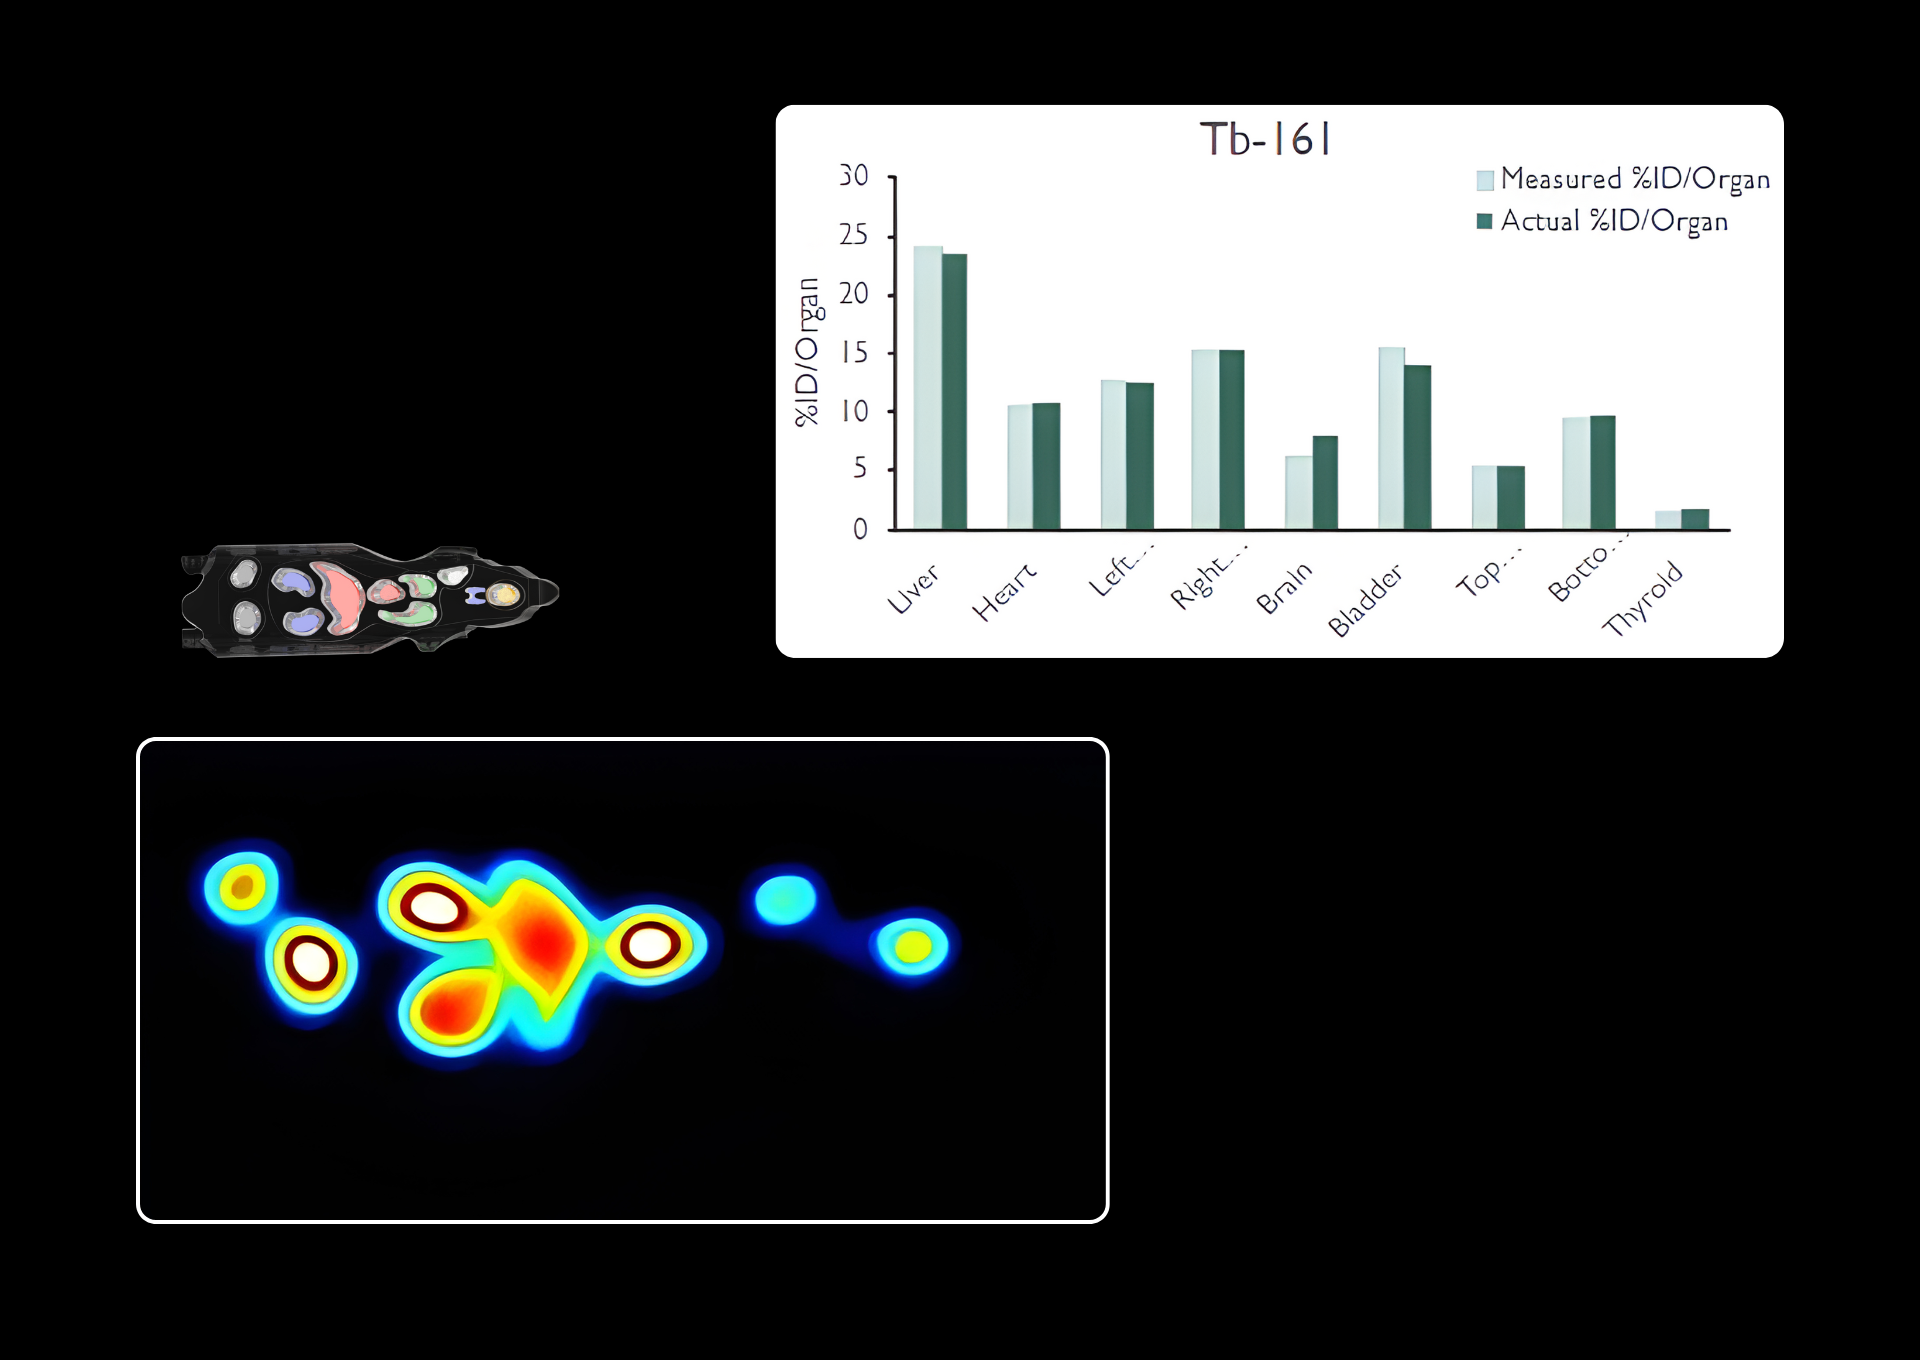
Figure 6: Mouse phantom imaging with ¹⁶¹Tb, acquired at characteristic energy peaks of the radionuclide, with corresponding activity quantification plots.
Gallium-67
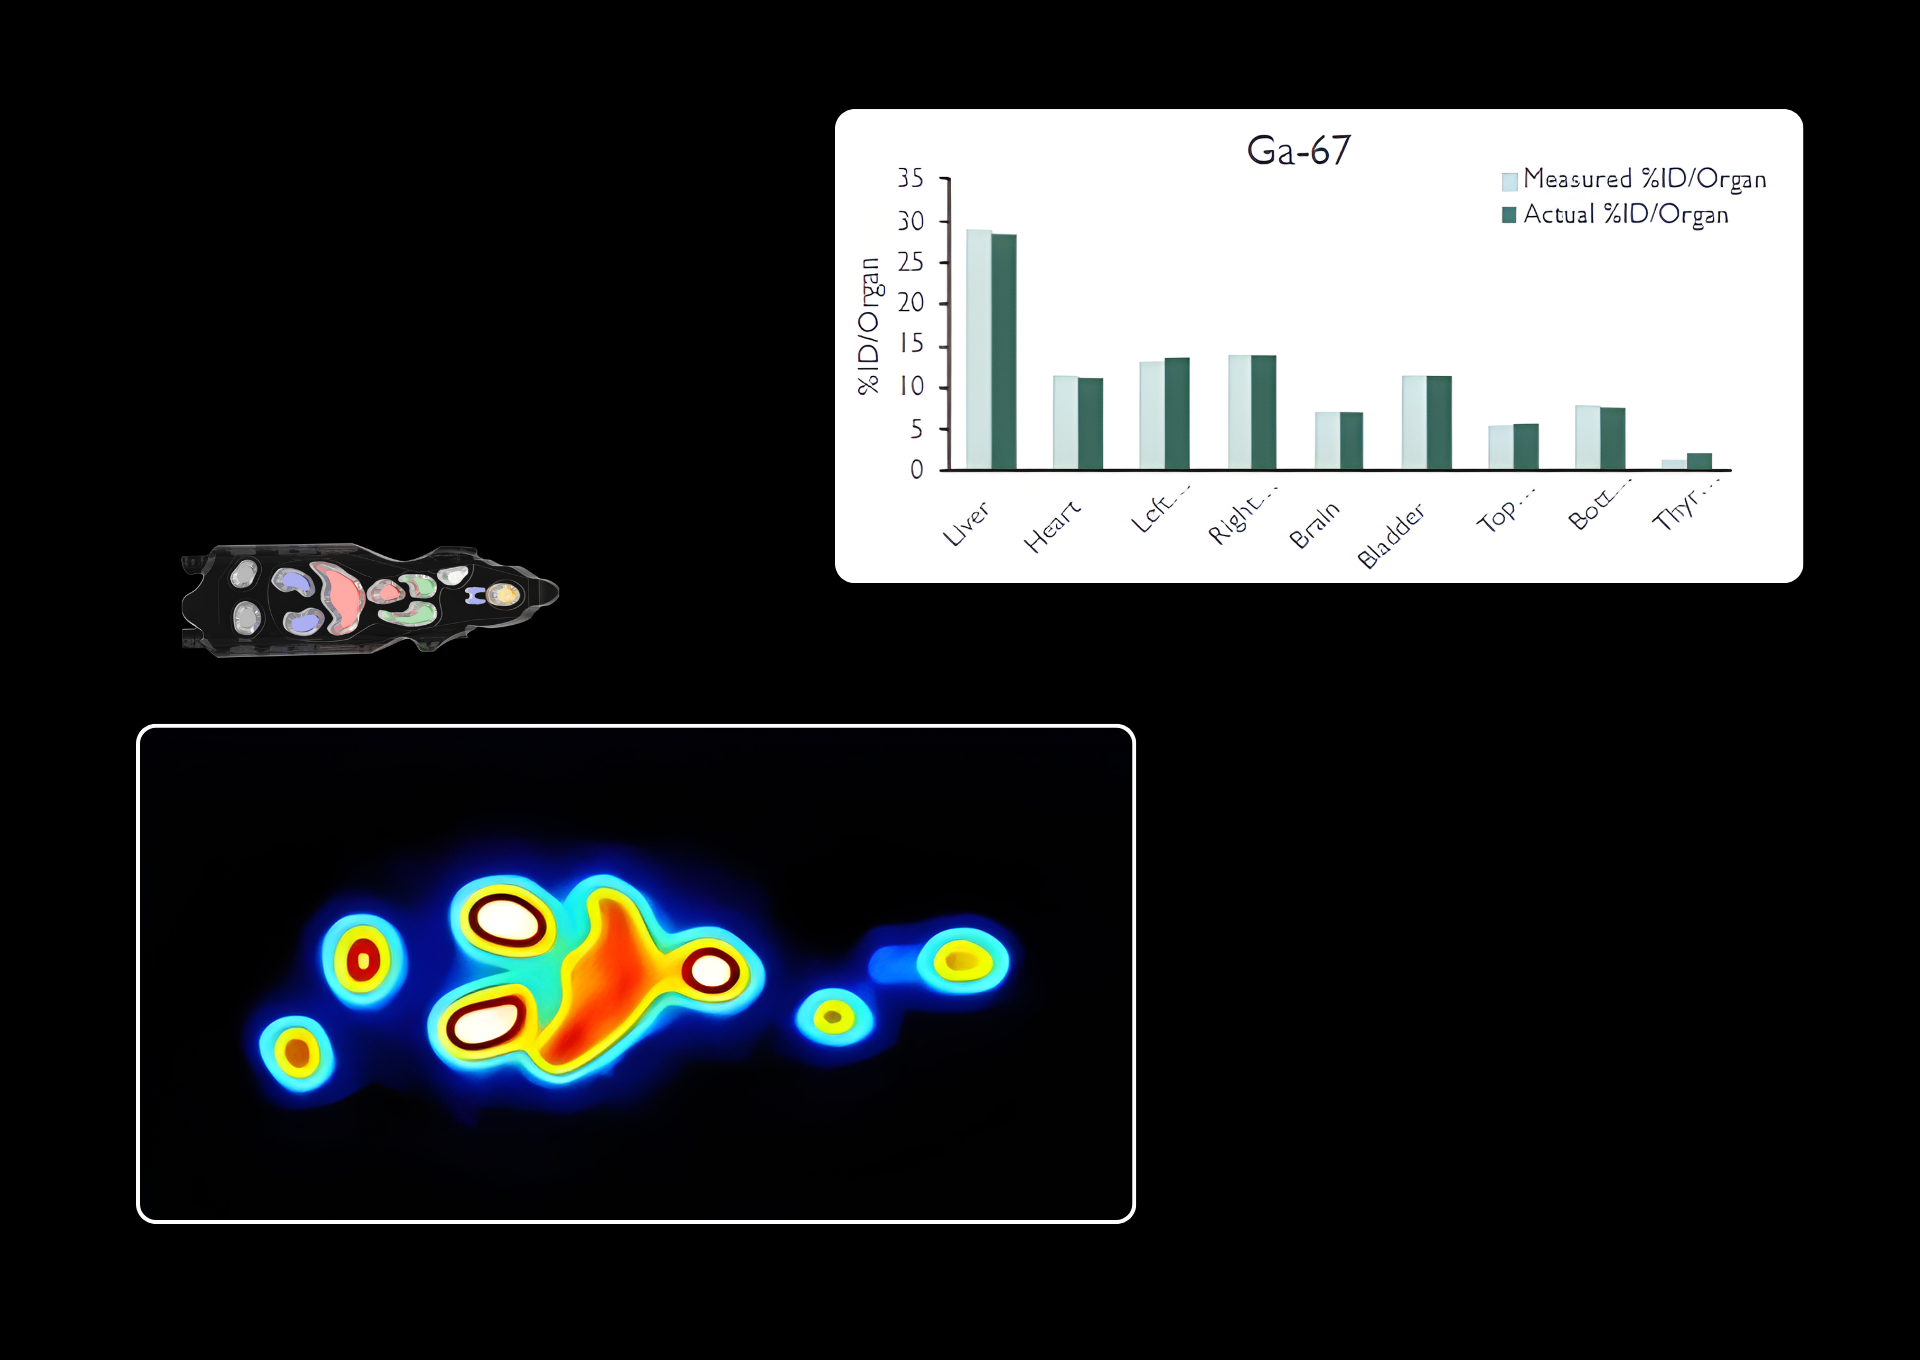
Figure 7: Mouse phantom imaging with ⁶⁷Ga, acquired at characteristic energy peaks of the radionuclide, with corresponding activity quantification plots.
Iodine-125
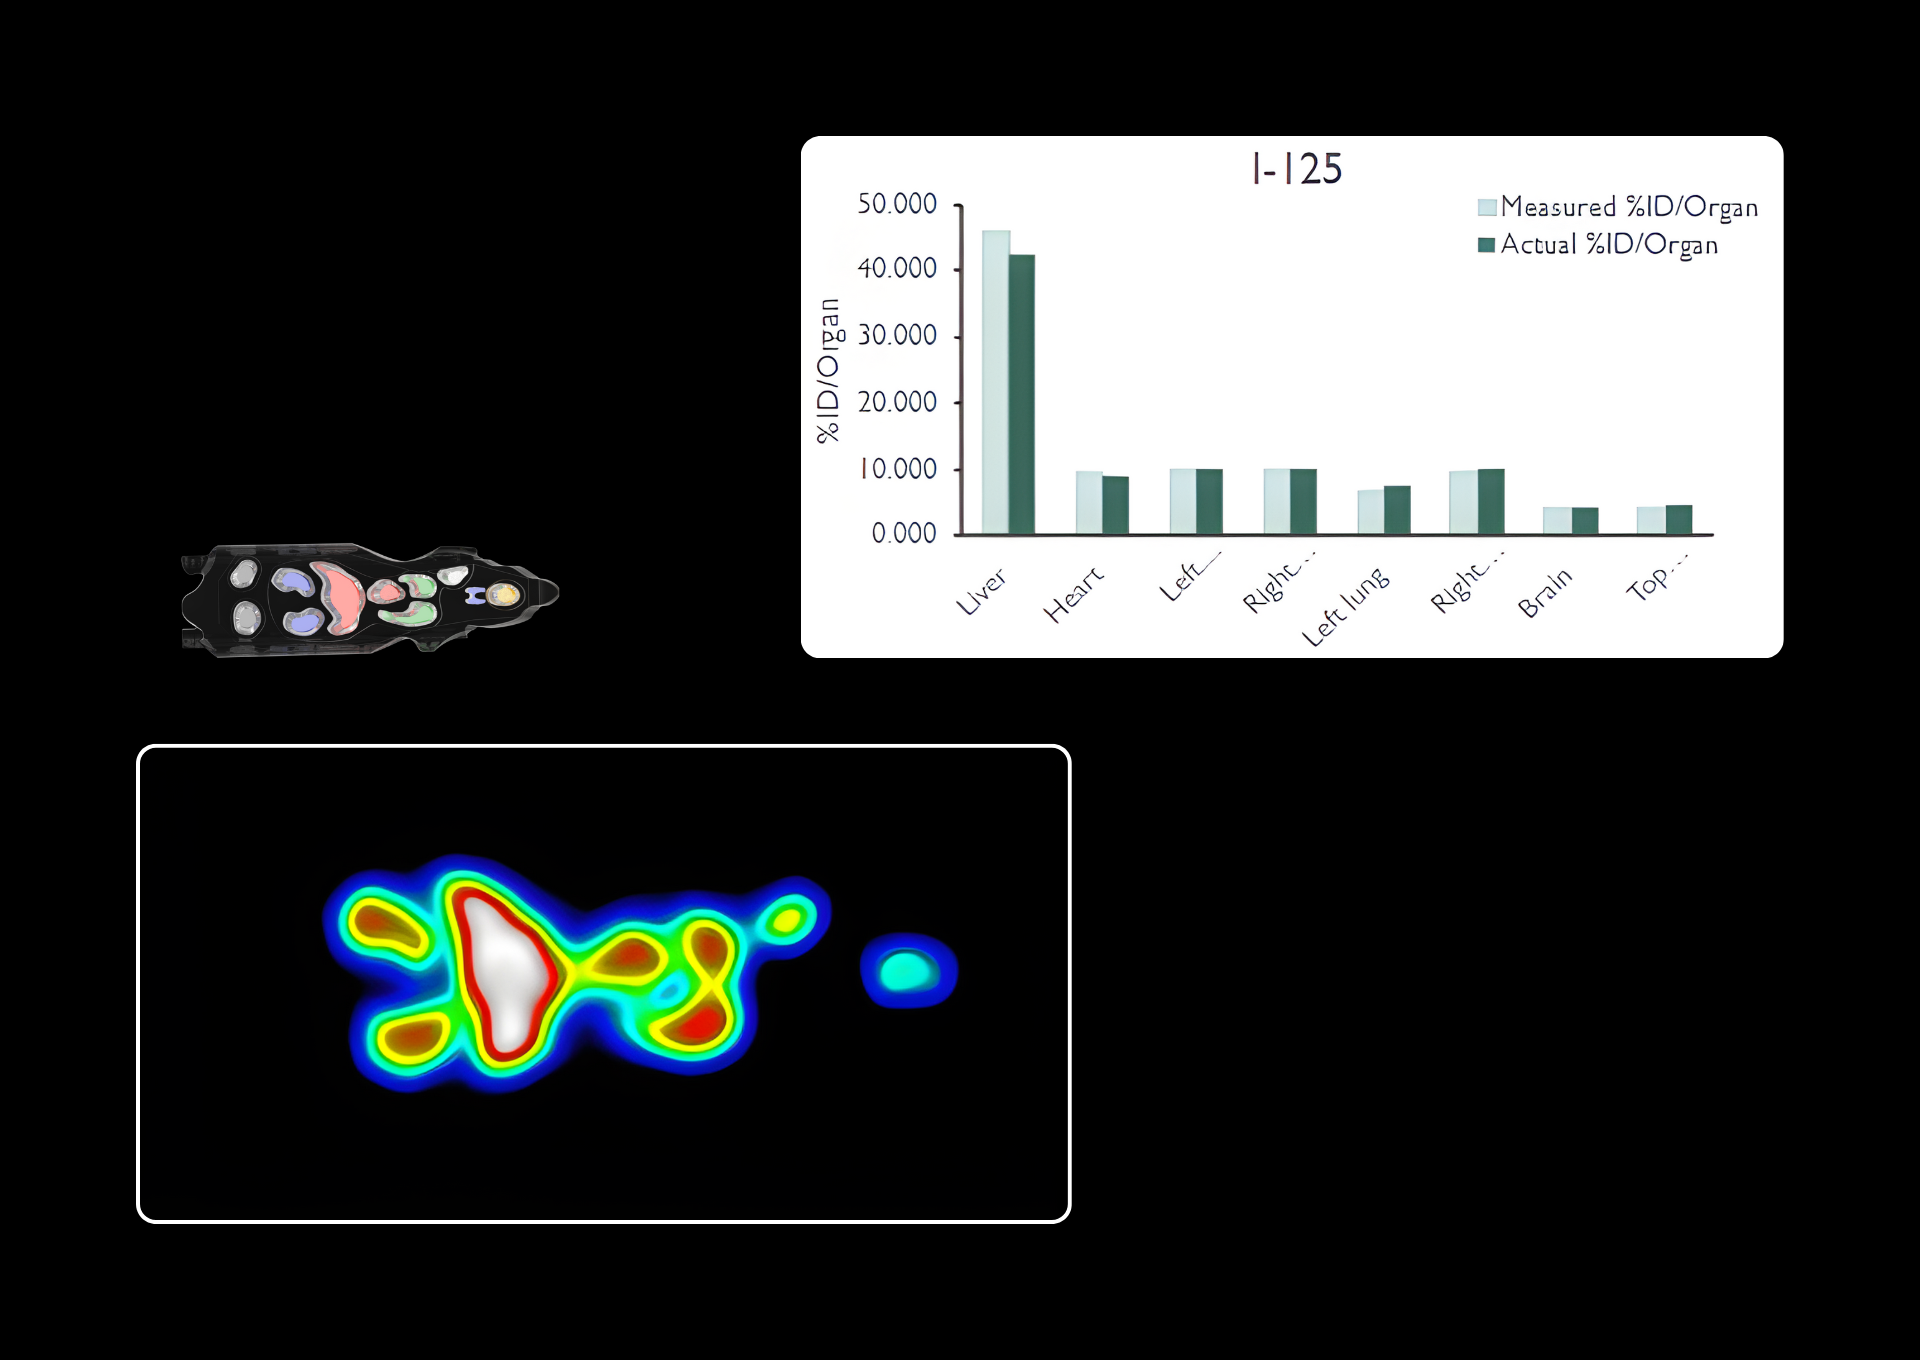
Figure 8: Mouse phantom imaging with ¹²⁵I, with corresponding activity quantification plots for activity analysis.
Indium-111
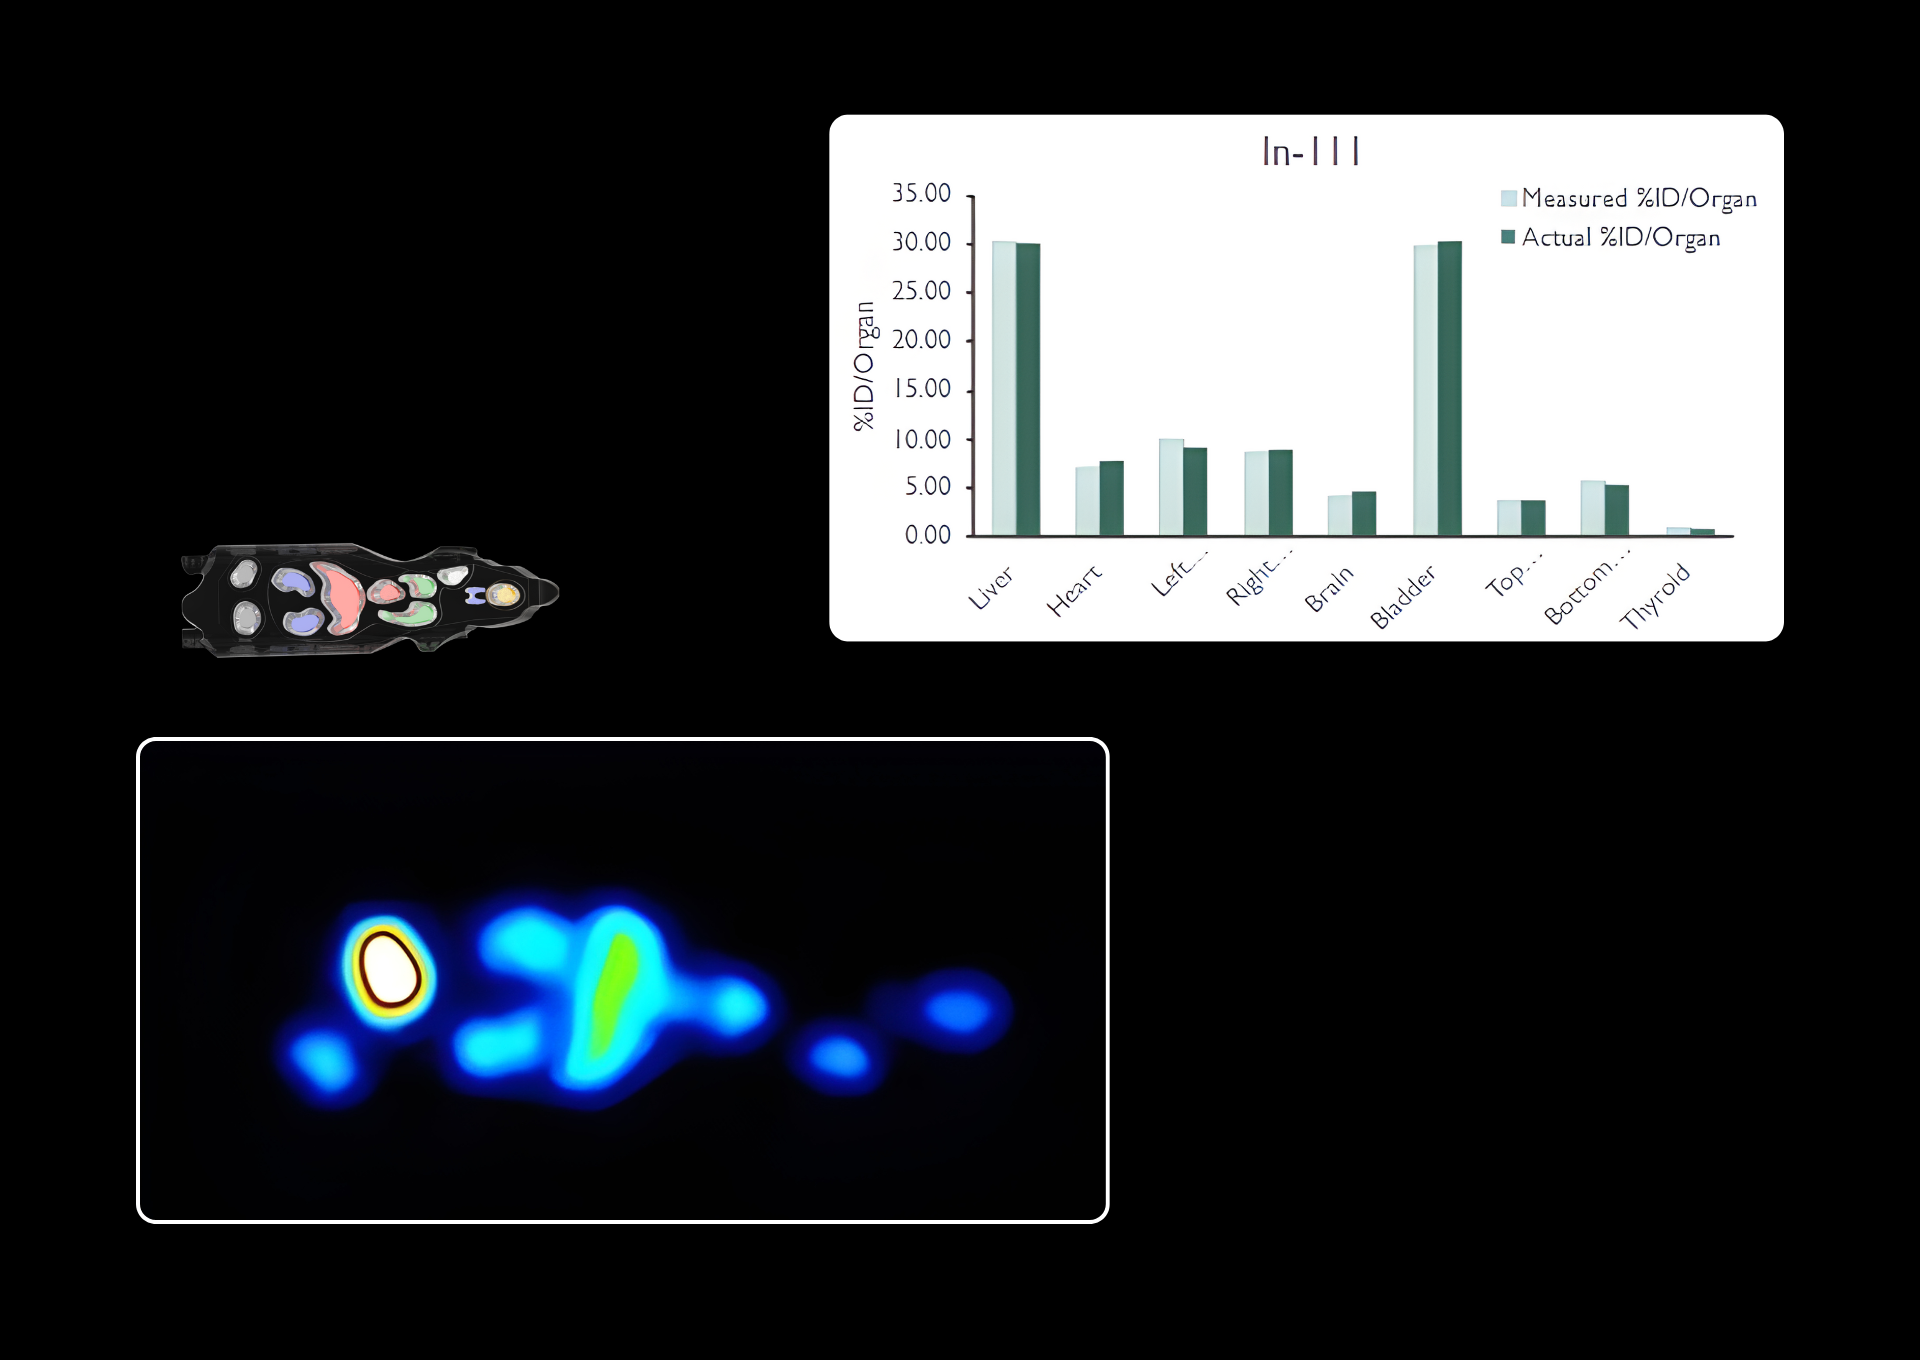
Figure 9: Mouse phantom imaging with ¹¹¹In, acquired at the 170 keV and 245 keV energy peaks, with corresponding activity quantification plots.
Technetium-99m
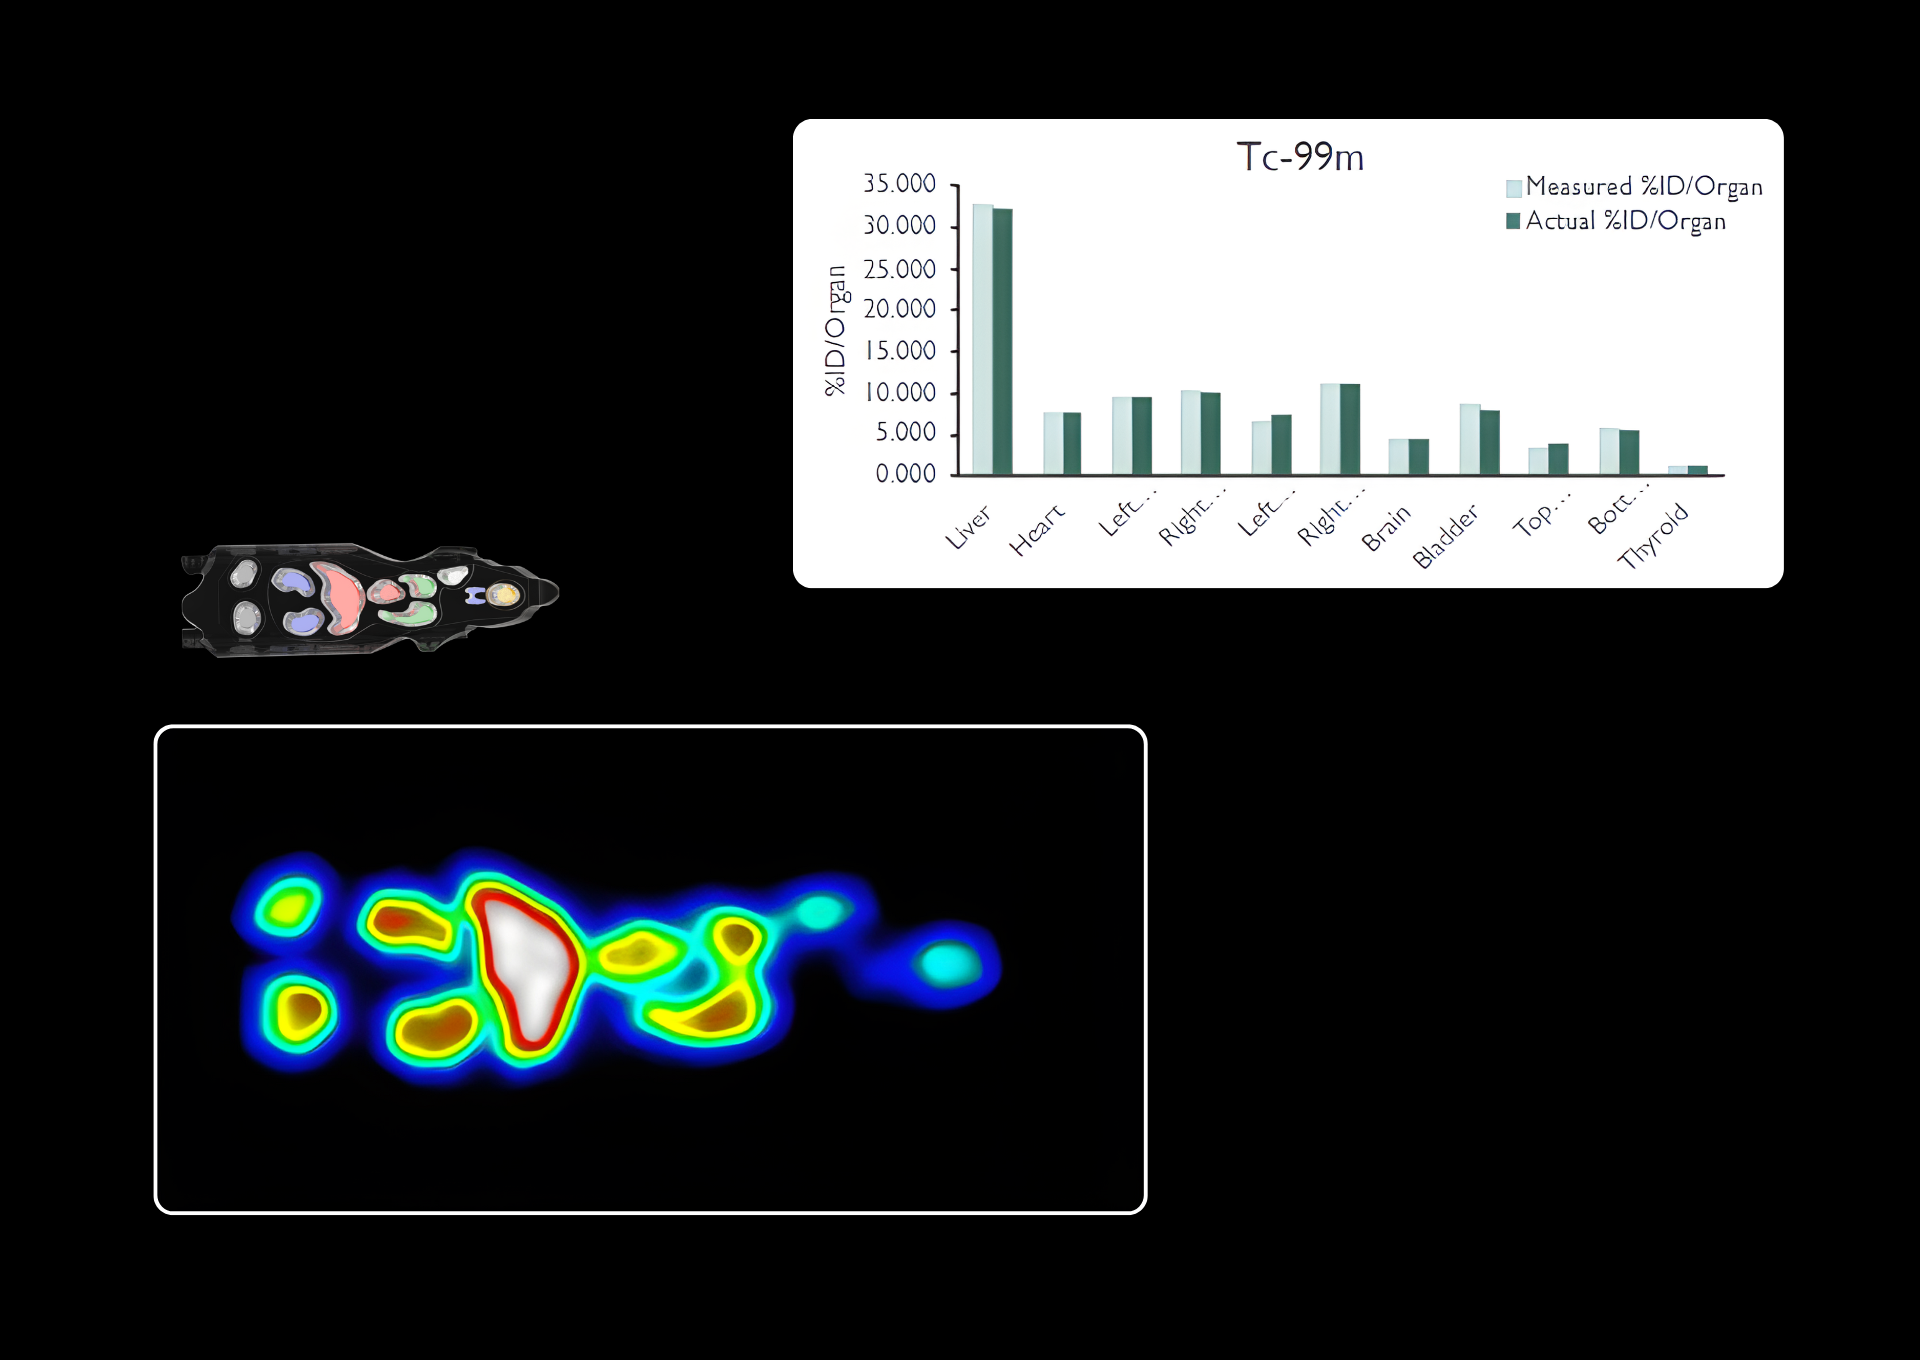
Figure 10: Mouse phantom imaging with ⁹⁹ᵐTc, acquired at the 140 keV energy peak, with corresponding activity quantification plots.