Introduction
Dedicated small-animal imaging systems have been continuously evolving, and their applications are strongly motivated by preclinical in vivo validation of drug effectiveness and safety, especially in nuclear imaging such as single photon emission tomography (SPECT) and positron emission tomography (PET)1. While the evolution in preclinical imaging is quite significant in recent years, the gold standard in any preclinical oncology experiment is still ex vivo biodistributions, an invasive method that requires many animals to be used. However, ex vivo biodistributions use metric scales that are, in some cases, more consistent between animals and humans2.
Already published studies have shown that both planar (2D) and tomographic (3D) imaging provide a high correlation to ex vivo studies3. These results are also reinforced by the results of a study, focused on combining planar and tomographic imaging to provide optimal preclinical results, using a smaller number of animals per study4. From a quantification point of view, these models also provide the drug exposure-response relationship that is essential for understanding the degree of antitumor activity linked to the drug under study. This allows the in vivo interpretation of tumor growth inhibition data that is later used for early clinical development5.
Herein, a set of 29 different oncology imaging studies, performed both on 2D and 3D commercial systems, are analyzed and compared. Results are compared against the gold standard biodistribution data, to evaluate the correlation between the three different methods of targeting quantification in preclinical oncology studies. Mass and radioactivity doses were identical and well-fitted for imaging purposes, since the exact same animals were used first for imaging and subsequently for biodistribution.
In addition, the ability of the 2D imaging technique to provide a faster and more cost-effective approach is investigated, as this approach combines various advantages including whole body image information, multiple time points on the same animal, dramatic minimization of required animals and significant reduction of overall study time.
Imaging Systems
Real-time, fast, dynamic screening studies were performed on dedicated benchtop, mouse-sized, planar scintigraphy systems (γ-eyeTM for SPECT isotopes detection and β-eyeTM for PET isotopes detection, both by BIOEMTECH). Both systems support fusion with a digital mouse photograph, for anatomical co-registration extraction of the X-ray mouse image, which is extracted from the mouse photo using artificial intelligence tools and can be used for mapping purposes6.
Tomographic SPECT/CT imaging was performed with two commercial tomographic systems: γ-CUBETM and x-CUBETM (Molecubes, Belgium) and GNEXT PET/CT (Sofie, USA). The γ-CUBETM system provides SPECT images7 and the accompanying x-CUBETM can provide CT images8. The nuclear imaging components do not include attenuation correction, but the CT component is calibrated periodically to read HUs.
Comparison between 2D and 3D imaging
The comparison between 2D and 3D imaging quantification data was implemented on 18 different oncology studies. The %counts/organ value was used as the value of comparison, for both SPECT and PET isotopes. The mean difference between 3D/ ex vivo biodistributions is 10.80%. Indicative imaging results of the 2D/3D imaging comparison, both for Tc-99m and In-111 agents are shown in Figure 1:
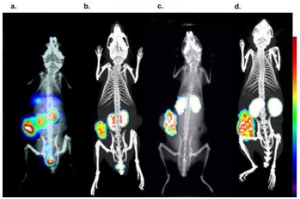
Figure 1: Tc-99m labelled tumor targeting peptide imaged with 2D and 3D imaging respectively and c, d) an In-111 labelled tumor targeting peptide imaged with 2D and 3D imaging, respectively. The color bar indicated the accumulation level (i.e., white being the highest and blue the lowest).
Statistical analysis between 2D, 3D and ex vivo biodistributions
For statistical comparison between 2D/3D, 3D/ ex vivo and 2D/ ex vivo biodistribution results, independent samples t-tests were conducted. The results revealed no statistically significant differences among the three different uptake quantification techniques as summarized in both Table 1 and Figure 2.
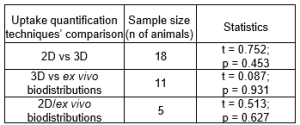
Table 1: The overall statistical difference between techniques which are under comparison. The statistical significance level was set at p = 0.05.
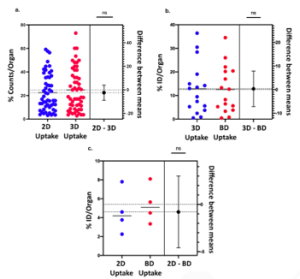
Figure 2: Statistical comparison via estimation plots. Each estimation plot shows the data (%ID/Organ) as a scatter graph (left axis) and the precision of the calculated effect size as a 95% confidence interval (right axis). Comparison between: a. 2D and 3D imaging uptake quantification studies, b. 3D imaging and ex vivo biodistribution uptake quantification studies and c. 2D imaging and ex vivo biodistribution uptake quantification studies.
Key Points
- The comparison between the three methodologies, to evaluate organ accumulation and tumor targeting, shows a non-significant deviation between 2D and 3D imaging and a similar deviation between 2D or 3D and post-imaging ex vivo
- If the suggested parameters are given the necessary attention, all methods can be accordingly trusted.
- Non-invasive imaging methodologies present a much faster, more ethical, and more economical way to implement preclinical research, when compared to ex vivo
- 2D imaging could potentially allow for acquisition across more research groups reducing, even more, the cost for some studies as the costly 3D imaging systems would not be required.
- The fact that quantification results in oncology models do not present significant differences between the tested methods, is a supporting factor for further improvement and a clear direction towards small-animal imaging, even using simple planar imaging.
References
- Franc, B. et al. Journal of Nuclear Medicine 49, 1651–1663 (2008).
- Blanchard, O. L. & Smoliga, J. M. The FASEB Journal 29, 1629–1634 (2015).
- Lauber, D. T. et al. Lab Anim 51, 465–478 (2017).
- Rouchota, M. et al. Mol Imaging 2021, (2021).
- Zhu, A. Z. Quantitative Translational Future Sci OA 4, (2018).
- Fysikopoulos, E. et al. Applied Radiation and Isotopes 180, 110034 (2022).
- Van Holen, R. et al. Med Phys 40, (2013).
- Guenter, R. et al. Surgery 167, 189–196 (2020).
Acknowledgments
This work would not have been completed, without the valuable collaboration and/or data produced by Benjamin Larimer, Chanelle Hunter, Suzanne Lapi, Hailey Houson, Adriana Massicano and Anna Sorace from the Small Animal Imaging Facility – Department of Radiology, The University of Alabama at Birmingham, USA, as well as Theodosia Maina, Berthold A. Nock and Panagiotis Kanellopoulos from Molecular Radiopharmacy, INRASTES, NCSR “Demokritos”, Athens, Greece.
Please note that all animal care and use was conducted according to animal welfare regulations in an AAALAC-like facility.
Author
Dr. Maria Kitsara
Science and Innovation Manager